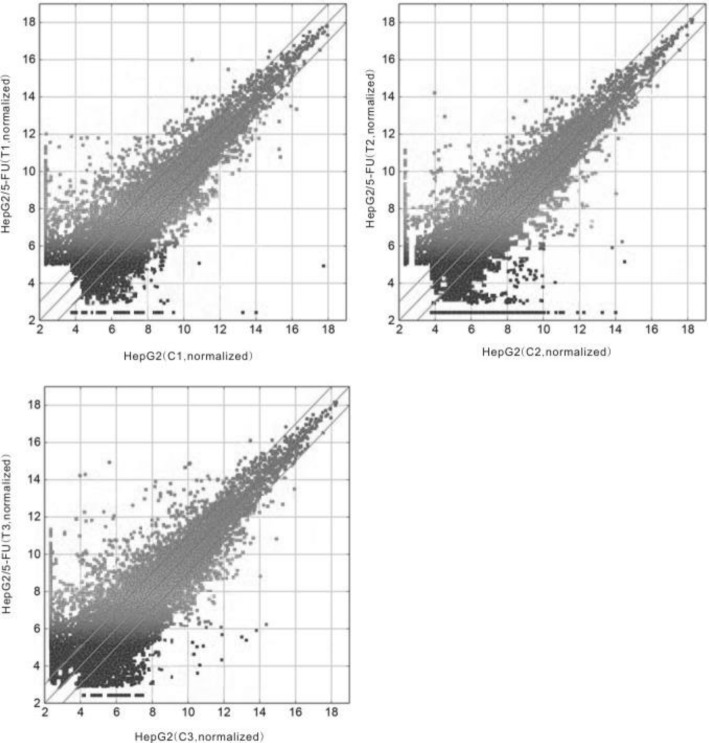
Fig. 2.
scatter plots were used for quality assessment of differentially expressed lncRNAs between HepG2/5-FU and HepG2 arrays. The averaged normalized values were shown in each group (log 2-scaled). The lncRNAs above the top line and below the bottom line are those with a > 2.0-fold change in expression between HepG2/5-FU and HepG2 arrays. The experiment was repeated three times

