Fig. 3.

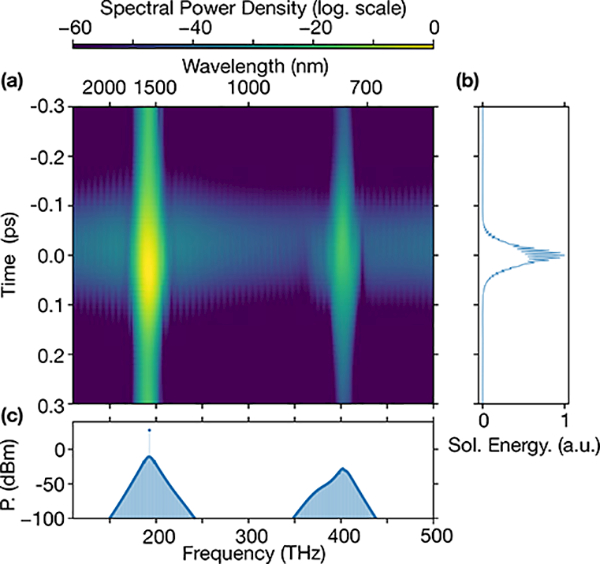
(a) Spectrogram of the two-color soliton (log-scale color map). (b) Temporal profile of the multicolor soliton. (c) Output spectrum of the two-color soliton; 0 dB is referenced to 1 mW (i.e., dBm).

(a) Spectrogram of the two-color soliton (log-scale color map). (b) Temporal profile of the multicolor soliton. (c) Output spectrum of the two-color soliton; 0 dB is referenced to 1 mW (i.e., dBm).