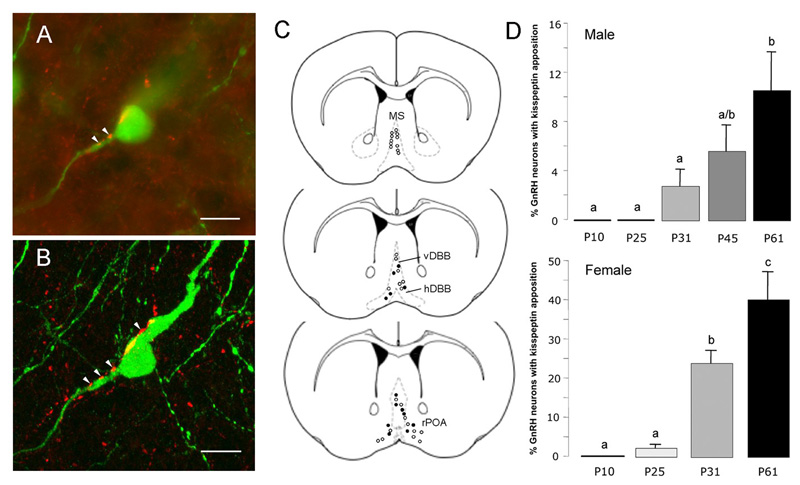
Figure 6. Postnatal development of kisspeptin fiber projections to GnRH neurons.
A. Confocal stack of 75 images showing a single GnRH neuron (green) with kisspeptin (red) fibers surrounding and opposed to it. Single 370nm-thick optical sections through the three regions indicated by a, b, c of the GnRH neuron are given below to demonstrate the close apposition between kisspeptin fibers and GnRH neuron elements. Scale bar represents 10μm. B depicts the levels at which GnRH neurons were analysed including the medial septum (MS), vertical limb of the diagonal band of Broca (vDBB), horizontal limb (hDBB) and the rostral preoptic area (rPOA). The distribution of GnRH neurons exhibiting kisspeptin fiber appositions is shown for an adult female mouse (open circles represent GnRH neurons with no close apposition; filled circles are GnRH neurons with kisspeptin appositions). C depicts the mean (+SEM) percentage of GnRH neurons with kisspeptin fiber appositions in males (top) and females (bottom) at different postnatal (P) ages. Bars labelled with different letters are significantly different from each other at p<0.05.

