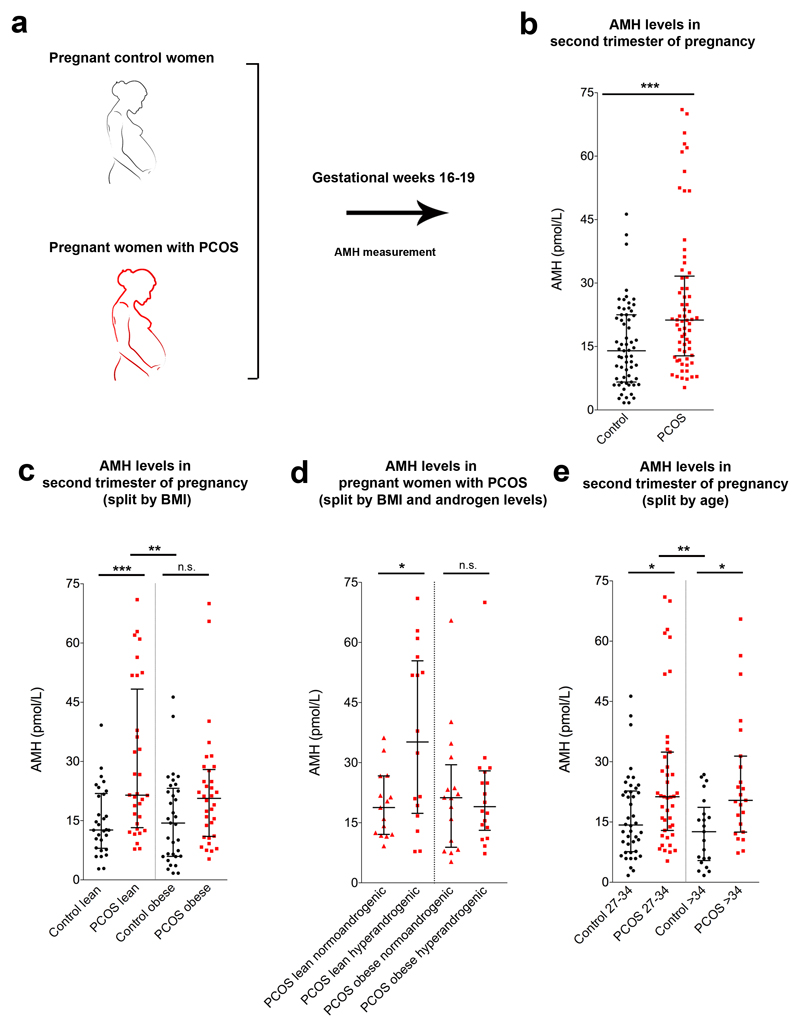
Figure 1. AMH levels during the second trimester of gestation are higher in women with PCOS than controls.
(a) Blood samples were derived from control and pregnant women with PCOS at gestational week 16-19 and AMH concentration was measured by ELISA. (b) Circulating AMH levels in control pregnant women (n = 63) and in pregnant women with PCOS (n = 66). Statistics by unpaired two-tailed Mann-Whitney U test, ***P ≤ 0.0001. (c) Circulating AMH levels in control pregnant women and in pregnant individuals with PCOS stratified by their body mass index (BMI) and classified into lean (Control lean n = 30, PCOS lean n = 32) and obese subjects (Control obese n = 33, PCOS obese n = 34). (d) Circulating AMH levels in pregnant women with PCOS stratified by their BMI and androgen levels (PCOS lean normoandrogenic n = 15, PCOS lean hyperandrogenic n = 16, PCOS obese normoandrogenic n = 16, PCOS obese hyperandrogenic n = 18). (e) Circulating AMH levels in control pregnant women and in PCOS pregnant subjects stratified by their age (Control 27-34 years old n = 42, PCOS 27-34 years old n = 43, Control > 34 years old n = 21, PCOS > 34 years old n = 23). The horizontal line in each plot corresponds to the median value from two technical replicates. The vertical line represents the 25th – 75th percentile range. Statistics in c-e were computed with one-way ANOVA (c: F(3, 125) = 7.534, P = 0.0001; d: F(3, 61) = 3.922, P = 0.0126; e: F(3, 125) = 6.282, P = 0.0005) followed by Bonferroni post hoc test, * P < 0.05, ** P ≤ 0.005, *** P ≤ 0.0005; n.s. = not significant.

