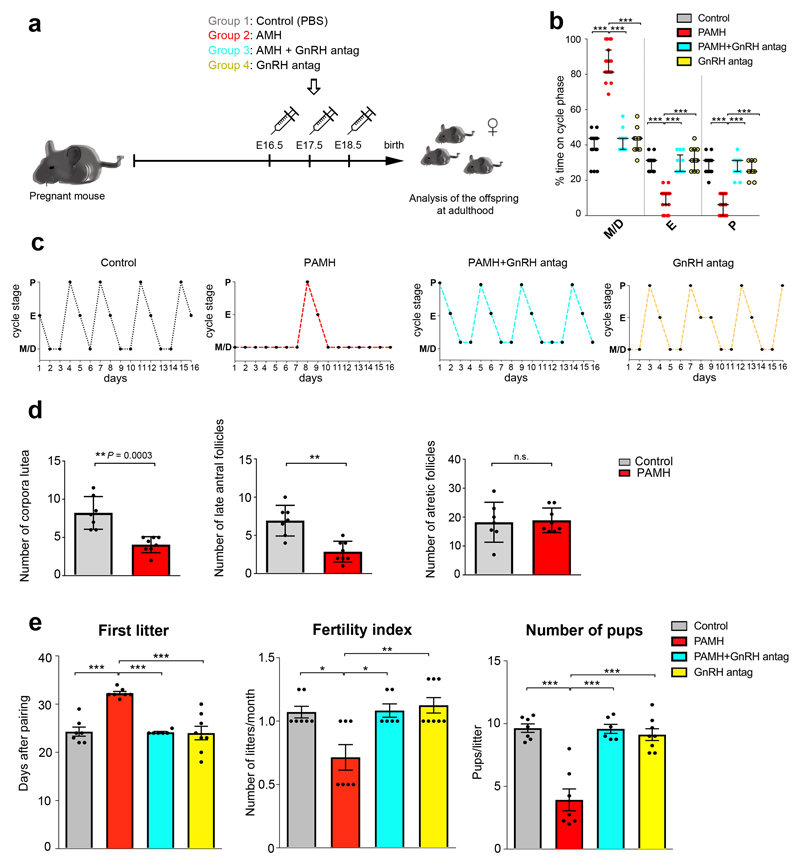
Figure 2. Prenatal AMH treatment disrupts estrous cyclicity, ovarian morphology and fertility in adult offspring.
(a) Schematic of experimental design whereby pregnant dams were subjected to different treatments of intraperitoneal (i.p.) injections during the late gestational period (embryonic days (E) 16.5 - E18.5). Pregnant dams (P90-P120; n = 34) were split into four treatment groups: PBS-treated (n = 8), AMH-treated (AMHc, n = 10), AMH+GnRH antag-treated (AMHc plus Cetrorelix acetate, n = 8), GnRH antagonist-treated (Cetrorelix acetate alone, 0.5 mg/Kg, n = 8). The offspring were designated as follows: Control, (PBS-treated); PAMH (Prenatal recombinant AMHc-treated); PAMH+GnRH antag, (PAMH plus Cetrorelix acetate); GnRH antag (Cetrorelix acetate alone). (b) Quantitative analysis of ovarian cyclicity in adult (P60-P90) offspring mice (Control, n = 15; PAMH, n = 19; PAMH+GnRH antag, n = 13; GnRH antag, n = 11). Vaginal cytology was assessed for 16 days. The horizontal line in each scatter plot corresponds to the median value. The vertical line represents the 25th – 75th percentile range. Comparisons between treatment groups were performed using Kruskal-Wallis test followed by Dunn’s post hoc analysis test; *** P < 0.0001. Data were combined from three independent experiments. (c) Representative estrous cyclicity of 10 mice/treatment group during 16 consecutive days. (d) Quantitative analysis of corpora lutea, late antral follicles and atretic follicles in the ovaries of Control (n = 7, age: P90) and PAMH mice (n = 8, age: P90). Statistics were performed with unpaired two-tailed Student’s t-test (corpora lutea, t(13) = 4.879, **P = 0.0003; late antral follicles, t(13) = 4.637, ** P = 0.0005; atretic follicles, t(13) = 0.226, P = 0.8243, n.s. = not significant). Data are represented as mean ± s.e.m. and were combined from two independent experiments. (e) Fertility tests of the adult offspring mice (P90). Mating was performed for 90 days. Control females were paired with Control males (n = 7), PAMH females were paired with PAMH males (n = 7 for each sex), PAMH+GnRH antag females were paired with PAMH+GnRH antag males (n = 6 for each sex), and GnRH antag females were paired with GnRH antag males (n = 8 for each sex). Data are represented as mean ± s.e.m. Statistics in e were computed with one-way ANOVA (First litter, F(3,24) = 18.14, P < 0.0001; Fertility Index, F(3,24) = 7.647, P = 0.0009; Number of pups, F(3,24) = 24.26, P < 0.0001) followed by Tukey’s multiple comparison post hoc test, * P < 0.05, ** P ≤ 0.005, *** P ≤ 0.0005. Data of fertility tests were combined from two independent experiments.

