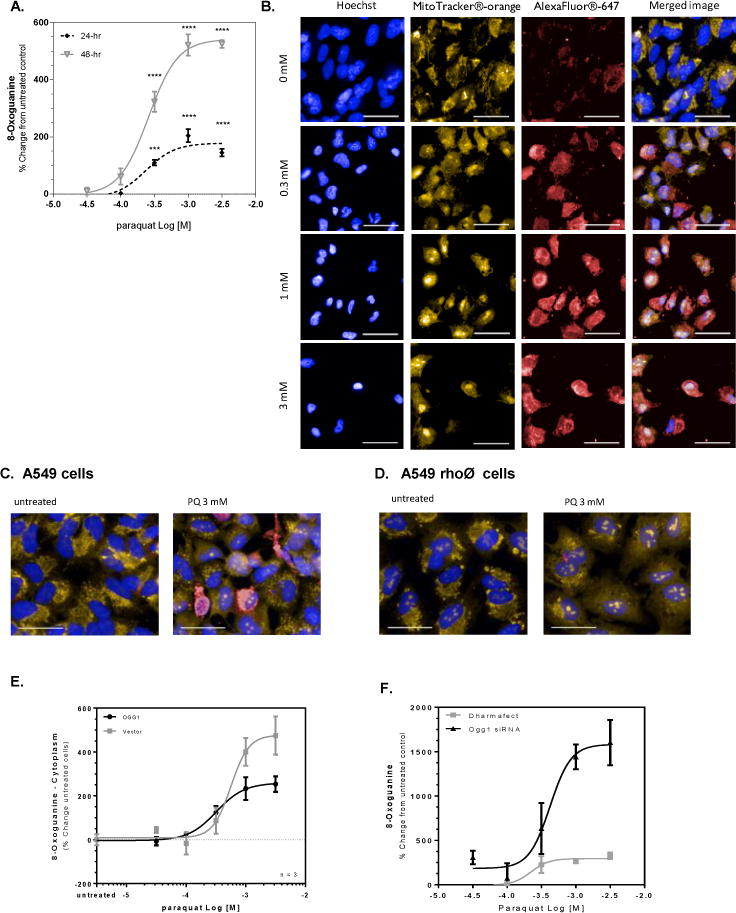
Figure 1. Paraquat-induced mitochondrial DNA damage is inversely related to OGG1 expression.

A549 cells were treated with paraquat for 24 or 48 hr and subjected to formaldehyde fixation prior to immunofluorescence detection of 8-oxoguanine. (A) Graphical representation of the percent change in 8-oxoguanine intensity within the cytoplasm region following 24- and 48-hr treated cells with increasing concentrations of paraquat. Significance was determined using a 1-way ANOVA with a Dunnett’s posttest comparing treatment groups to an untreated control (* p<0.05, ** p<0.01, *** p<0.001, **** P<0.0001). B. Changes in 8-oxoguanine are depicted in sample images (Hoechst33342, overlaid blue; MitoTracker® orange, overlaid orange; 8-oxoG, overlaid red) from cells exposed to increasing concentrations of paraquat in panel B (line = 40 μm). (C/D) A549 cells were treated with 50 ng/mL ethidium bromide for 14 population doublings to generate A549rhoφ cells devoid of functional mitochondrial DNA. A549 and A549rhoφ cells were treated with paraquat for 24 hr, followed by staining for 8-oxoG. (C) Sample images of A549 cells from wells containing untreated cells and cells exposed to 3 mM paraquat for 24 hr (line = 40 μm). (D) Sample images like Panel C, but with A549rhoφ cells (line = 40 μm). (E) A549 cells were incubated with 5% v.v. Ogg1-BacMam for 48 hours prior to treatment with varying concentrations of paraquat for 24 hr. The cells were subjected to formaldehyde fixation for immunofluorescence detection of 8-oxoguanine and the percent change in 8-oxoguanine intensity within the mitochondria of the cells from varying concentrations of paraquat compared to control cells. (F) A549 cells were incubated with 100 nM Ogg1 siRNA containing Dharmafect® in serum-free conditions. Following 48-hr incubation, the medium was replaced to complete culture medium and the A549 cells were treated with varying concentrations of paraquat for 24 hr. The cells were stained and imaged for 8-oxoguanine. The figure represents the percent change in 8-oxoguanine intensity within the mitochondria of paraquat treated cells compared to media control.
