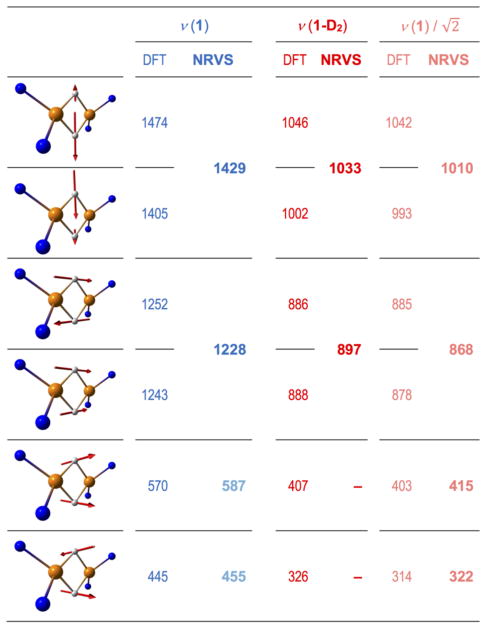
Chart 1.
Arrow-style graphic representation of the principal iron-hydride normal modes along with their computed frequencies (DFT) and corresponding observed (NRVS) band positions (cm−1) for 1 (in blue) and 1-D2 (in red). Frequencies for 1-D2 projected from 1 based on H-to-D isotopic mass shift and tentatively assigned Fe-H-Fe wagging NRVS features are in semi-transparent colors. Only the core Fe sites and their first-shell ligand atoms are shown. Animations of the DFT normal modes are available in Supporting Information.

