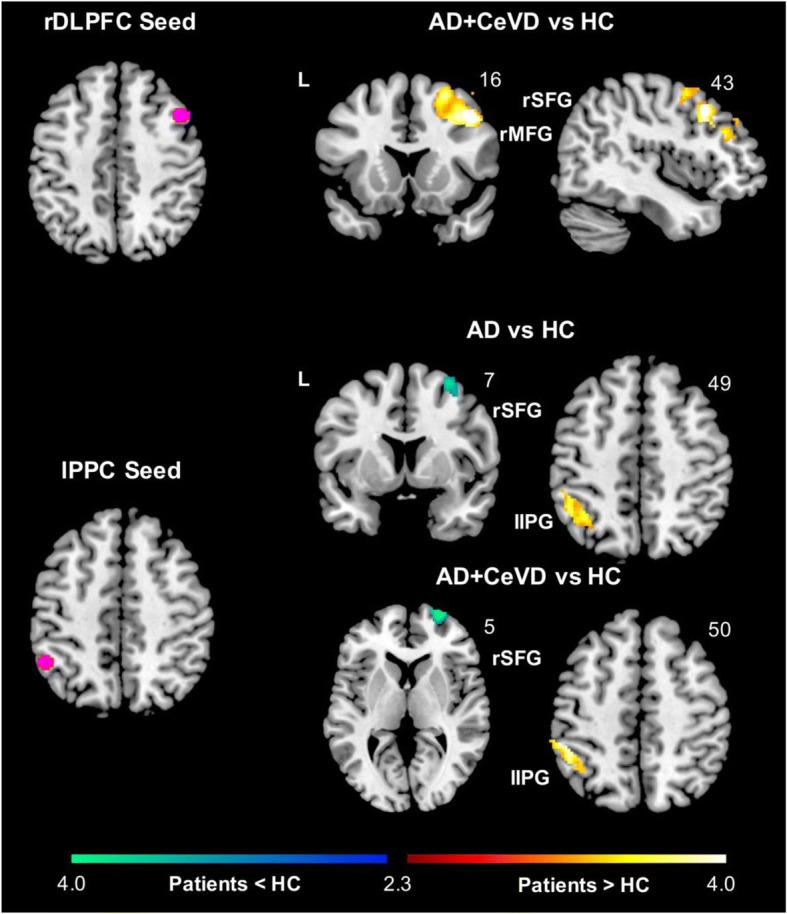
Fig. 2.

Distinct executive control network functional connectivity changes in subjects with and without cerebrovascular disease. Group functional connectivity difference maps were overlaid on the MNI template brain. The maps highlight regions showing increased (hot color) or decreased functional connectivity (cold color) in patient groups compared with HCs for the executive control network (ECN). AD+CeVD subjects showed increased intra-ECN frontal FC for the rDLPFC seed and parietal FC for the lPPC seed while AD subjects showed higher parietal FC compared with HCs for the lPPC seed. Frontoparietal FC was reduced in AD and AD+CeVD subjects compared with HCs for the lPPC seed. AD Alzheimer’s disease, aMCI amnestic mild cognitive impairment, ANG right angular gyrus, CeVD cerebrovascular disease, FC functional connectivity, HC healthy controls, IPG inferior parietal gyrus, l left, lPPC left posterior parietal cortex, MFG middle frontal gyrus, rDLPFC right dorsolateral prefrontal cortex, r right, SFG superior frontal gyrus
