Fig. 2.
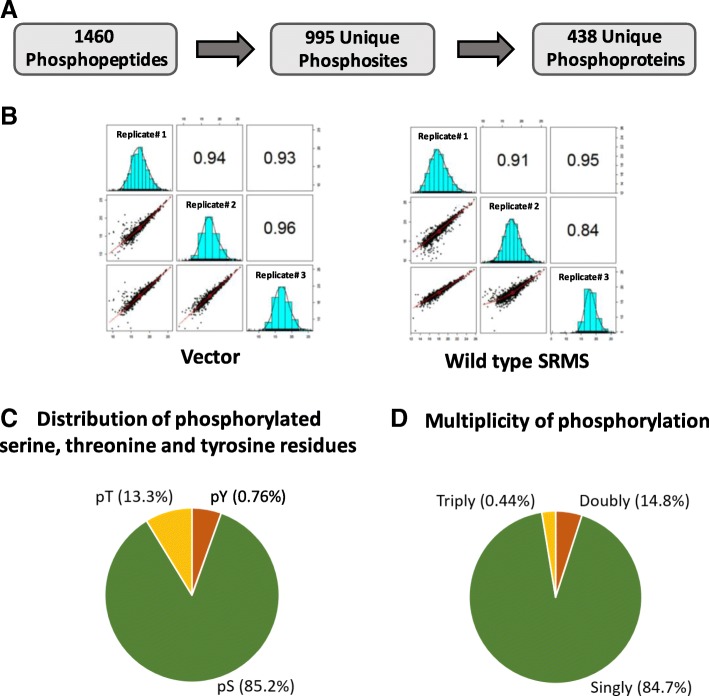
Identification of the phosphoproteome. a The coverage of the phosphoproteome showing the total number of identified phosphopeptides, unique phosphosites and unique proteins mapping from the phosphopeptides. b Pearson’s correlation analyses of the 3 replicate datasets corresponding to the vector control and wild type SRMS phosphoproteome. The Pearson’s correlation coefficients and associated distribution curve histograms between Replicate 1, 2 and 3 for both experimental conditions are reflected in a matrix format. c Pie-chart representation of the multiplicity of phosphorylation of the identified phosphopeptides indicating the percentage of phosphopeptides carrying either a single phosphosite, double phosphosites or triple phosphosites. d Pie-chart depiction of the proportion of phosphoserine, phosphothreonine and phosphotyrosine sites in the identified phosphoproteome

