
Figure 7.
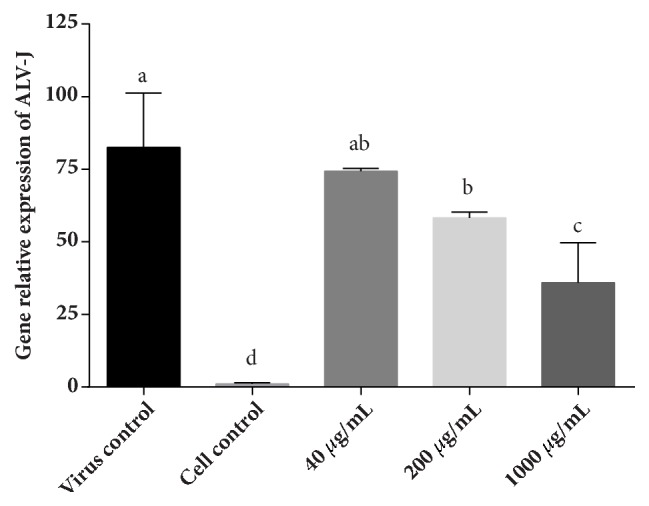
Gene relative expression of ALV-J. DF-1 cells inoculated with ALV-J and polysaccharides of different concentration for 2 h simultaneously. Then the cells were washed by PBS and covered with MM for 24 h. After that, the cells were collected for RT-PCR assay. Values represent mean + standard deviation (n=3). Statistical significance p < 0.05, compared with each other.