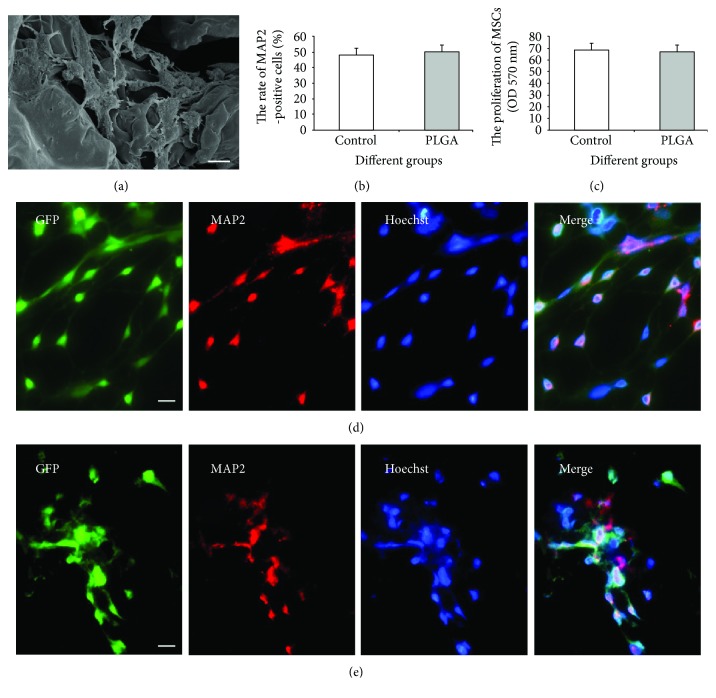
Figure 3.
The effect of the PLGA scaffold on the differentiation and proliferation of MSCs in vitro. (a) SEM imaging of induced MSCs planted on the PLGA scaffold. Bar = 10 μm. (b) The rate of MAP2-positive cells among the MSCs after neural induction. (c) The proliferation of MSCs on the coverslip and PLGA scaffold. The control group (d) and the PLGA scaffold group (e): green fluorescence showed MSCs in vitro. Neurons (MAP2 positive) were stained with red fluorescence. Yellow fluorescence showed the colocalization of green and red, thus indicating the differentiation of MSCs. Bar =50 μm.

