Figure 1.

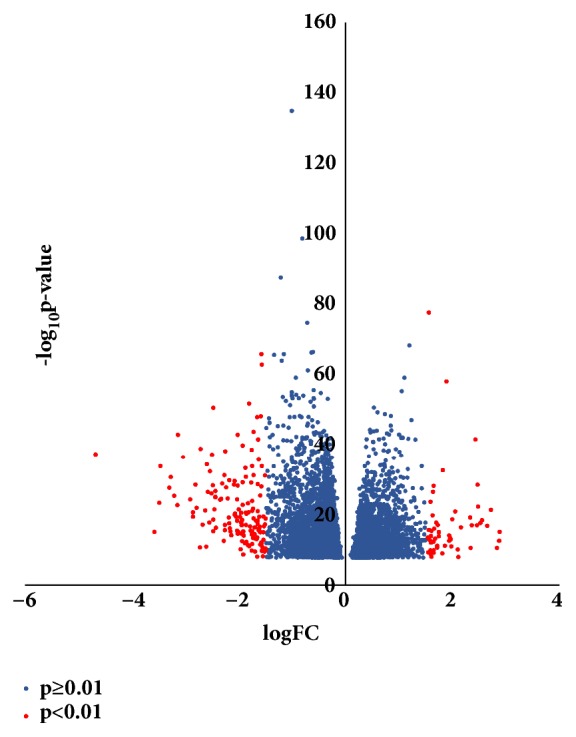
Volcano plot of 6891 genes. Red plots represented genes with fold change ≥1.5 or ≤-1.5, p<0.01. Blue plots represented the rest of the genes with no significant expression change.

Volcano plot of 6891 genes. Red plots represented genes with fold change ≥1.5 or ≤-1.5, p<0.01. Blue plots represented the rest of the genes with no significant expression change.