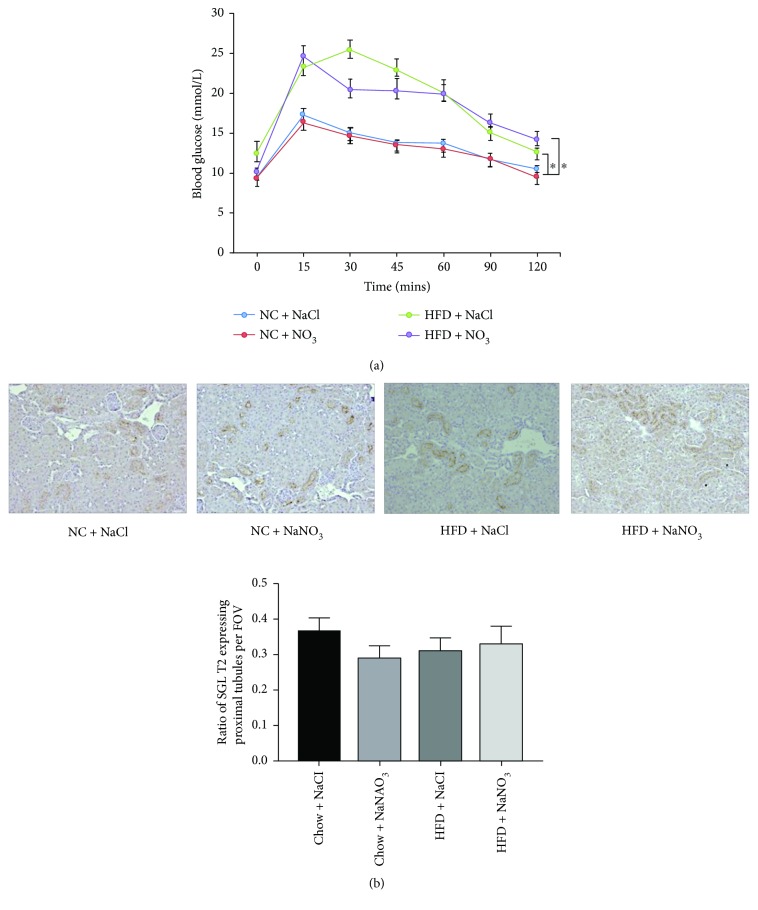
Figure 2.
(a) Fasting glucose tolerance testing in C57BL6 mice fed a normal chow or HFD with or without dietary nitrate for 12 weeks. n = 10/group, ANOVA (∗p < 0.05). (b) Representative immunohistochemistry images (depicted by brown staining, magnification at 200×) and the ratio of renal proximal tubule expression of SGLT2 in C57BL6 mice fed a normal chow or HFD with or without dietary nitrate for 12 weeks (n = 5/group; FOV: field of view).

