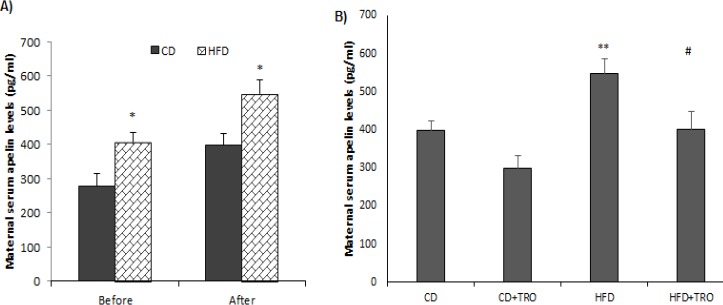
Figure 5.
(A) Total serum maternal apelin levels before and after pregnancy. Paired sample t-test; *P<0.05 indicates the difference in the CD groups and HFD groups before and after pregnancy. (B) The effect of HFD and troxerutin on serum total apelin levels of dams at the end of lactation. One-way ANOVA followed by LSD post hoc test; **P0.01 vs. CD group; #P<0.05 vs. HFD group. Data are expressed as mean±SEM (n=7). [CD: control diet; TRO: troxerutin; HFD: high fat diet]

