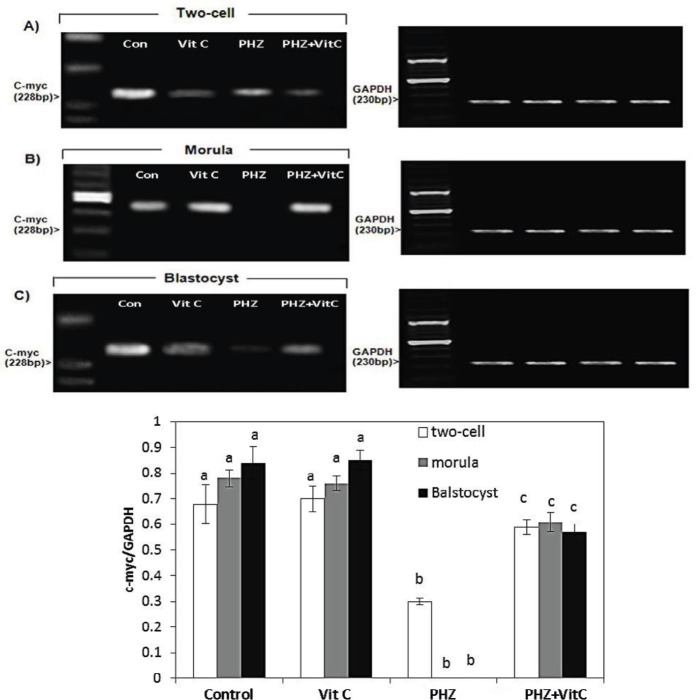
Figure 5.
mRNA levels of c-myc in (A) Two-cell embryo, (B) Morula and (C) Blastocyst in different test and Control groups. Anemia down-regulated the mRNA level of c-myc at the two-cell embryo stage. No mRNA was exhibited at morula stage and the mRNA level was decreased at blastocyst stage. The enhanced mRNA level of c-myc in Vit C-treated, PHZ animals morula and blastocyst can be observed in this Figure. The c-myc/GAPDH density was measured by densitometry and normalized to GAPDH mRNA expression level and compared between the groups (D) All data are presented in Mean±SE. Different superscripts (a,b,c) shows the significant differences between the different groups (P<0.05).

