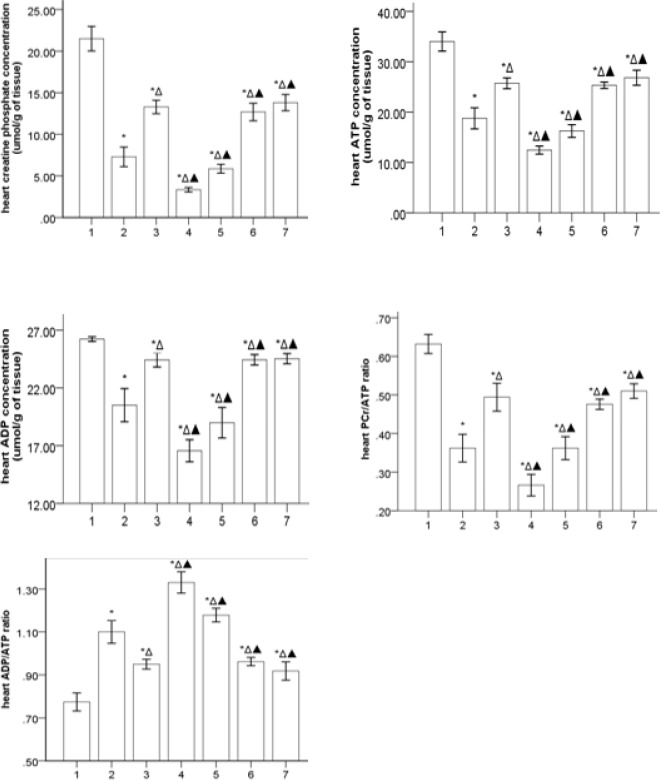
Figure 2.
Heart high energy phosphate substrate profiles in different groups (`x±s, n=5) 1, 2, 3, 4, 5, 6, and 7 represent control, HF, Gs-Rbl, ara A-1, ara A-2, Aicar-1, and Aicar-2 groups, respectively. PCr/ATP ratio: there was significance in ara A-1 and ara A-2 groups (P=0.024), and there was no significance in Gs-Rbl, Aicar-1, and Aicar-2 groups. ADP/ATP ratio: the ratio was decreased in the ara A-2 group more than in the ara A-1 group (P=0.020), and there was no significance in Gs-Rbl, Aicar-1, and Aicar-2 groups. *P<0.05 vs control group; ΔP<0.05 vs HF group; ▲P<0.05 vs Gs-Rbl group

