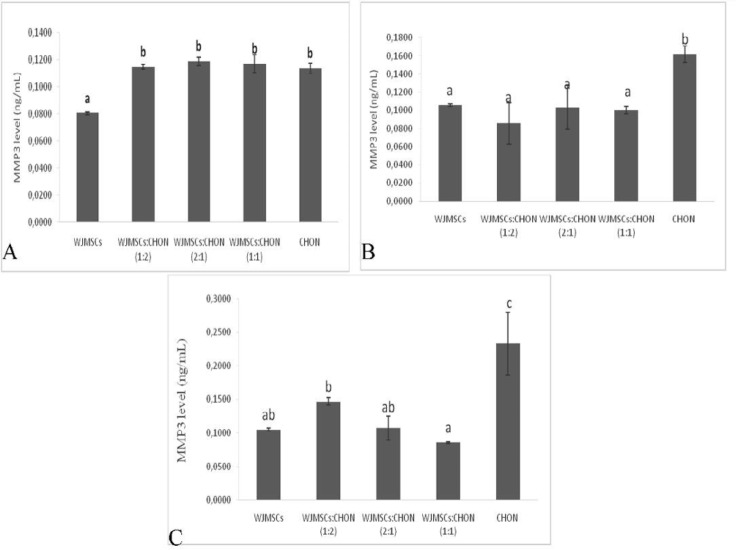
Figure 5.
Levels of MMP3 in IL1β-CHON002 and IGF1-WJMSCs co-cultures
A. Effect of varied ratios of non-induced WJMSCs and non-induced CHON002 toward MMP3 level. Different letters (a,b) are significant among ratios of WJMSCs and CHON002 (1:0, 1:2, 2:1, 1:1, 0:1) toward MMP3 level based on Duncan’s post hoc test (P<0.05)
B. Effect varied ratios of IGF1 75 ng/ml-induced WJMSCs and IL1β 5 ng/ml-induced CHON002 toward MMP3 level. Different letters (a,b) are significant among ratios of IGF1 75 ng/ml induced-WJMSCs and IL1β 5 ng/ml-induced CHON002 (1:0, 1:2, 2:1, 1:1, 0:1) toward MMP3 level based on Duncan’s post hoc test (P<0.05)
C. Effect of varied ratios of IGF1 120 ng/ml-induced WJMSCs and IL1β 10 ng/ml-induced CHON002 toward MMP3 level. Different letters (a,ab,b,c) are significant among ratios of IGF1 120 ng/ml induced-WJMSCs and IL1β 10 ng/ml-induced CHON002 (1:0, 1:2, 2:1, 1:1, 0:1) toward MMP3 level based on Duncan’s post hoc test (P<0.05)

