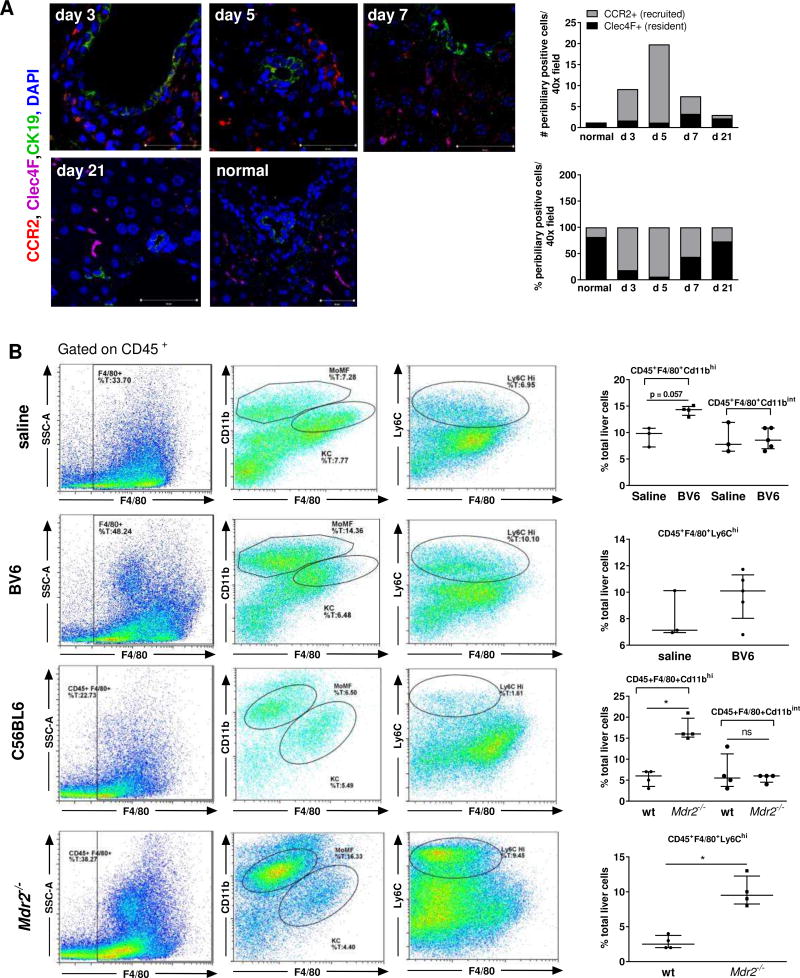
Fig. 4. Macrophages accumulate in the peribiliary areas of Mdr2−/− mouse livers.
(A) Clec4F (KC), CCR2 and CK19 liver co-immunofluorescence on normal and BV6-injected mice (day 3–21); quantification of Clec4F+ and CCR2+ cells (n=3/group). (B) Representative flow cytometric plots showing CD45+F4/80+ liver macrophage population, CD45+F4/80+CD11bhi monocyte-derived macrophages (MoMF), CD45+F4/80+CD11bint Kupffer cells (KC) and CD45+F4/80+Ly6Chi inflammatory macrophages in the liver of saline- or BV6-injected mice (day 5), and sixty-day old C57BL/6.Mdr2−/− mice. Quantification shown on the right (3 saline, 5 BV6, 4 C57BL/6, 4 Mdr2−/−). *p<0.05 (Mann-Whitney).

