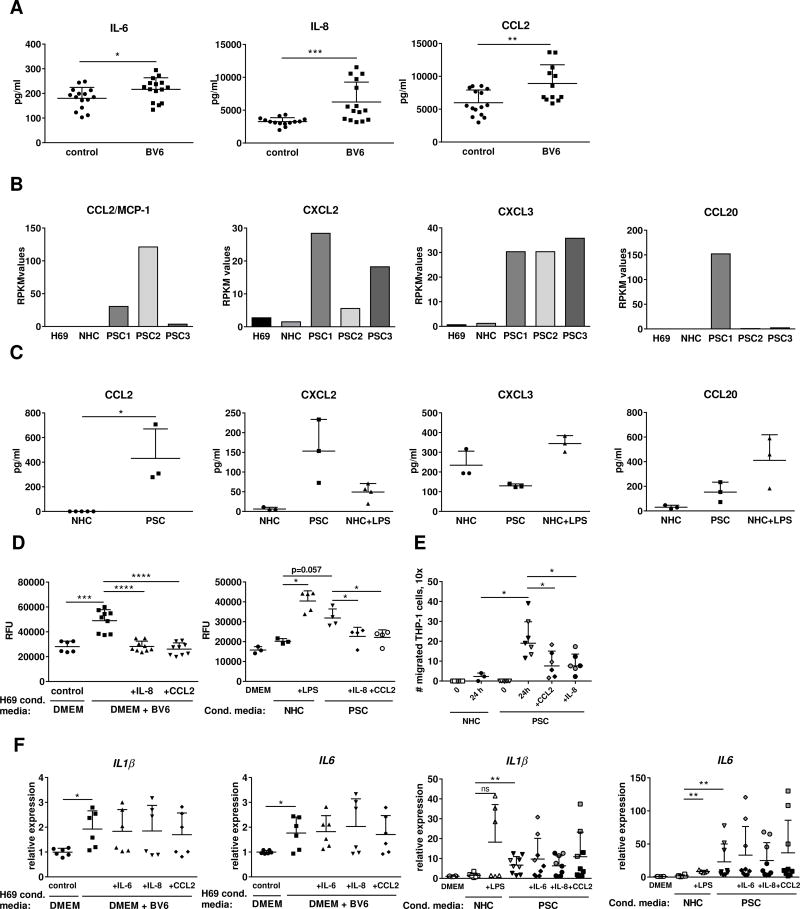
Fig. 5. Active and senescent cholangiocytes release monocyte chemoattractants and macrophage-activating factors.
(A) ELISA on supernatants of H69 cells treated with DMEM + BV6 (n=3 in quintuplicate). (B) Transcriptomic profiles of H69, NHC and isolated PSC cholangiocytes by high-throughput NGS. (C) ELISA on supernatants from isolated PSC cholangiocytes (n=3) or NHC + LPS (n=3). RPKM: reads/kilobase of transcript/million mapped reads. (D) THP-1 cell transmembrane migration following exposure for 6 hours to conditioned media as in (A), or (C), ± neutralizing IL-8 or CCL2 antibodies. THP-1 exposed to DMEM used as controls (DMEM)(BV6 n=3; NHC+LPS n=3; PSC n=4 at different times from PSC-1). RFU: relative fluorescent units. (E) THP-1 cell migration in a dual-chamber microfluidic device after 24 hr. co-culture (PSC1, black symbols, PSC2, grey symbols, n=3 each). (F) Gene expression in THP-1 cells incubated with conditioned media as in (A) or (C) (PSC1, black symbols, n=6; PSC2, grey symbols, n=3). *p<0.05; **p<0.005; ***p<0.0005; ****p<0.0001 (Mann-Whitney).

