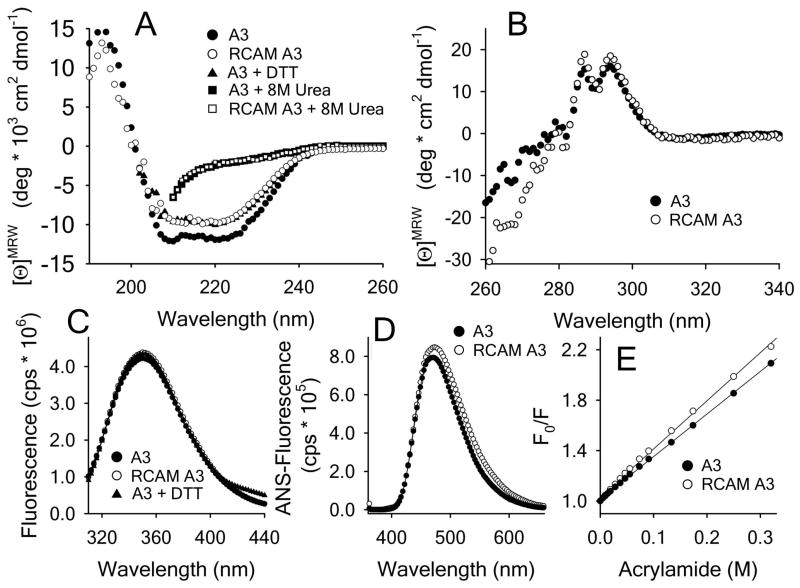
Figure 1.
Spectroscopic properties of A3 and RCAM A3. A) Far UV CD (190–260nm) spectra in presence/absence of 5mM DTT and 8M urea at 20°C. B Near UV CD (260–360nm) spectra at 20°C. C) Intrinsic fluorescence spectra (1μM concentration) in the presence/absence of 5mM DTT using a 280nm excitation wavelength. D) ANS spectra after 1h incubation of 1μM protein with 100μM ANS using a 350nm excitation wavelength. E) Acrylamide quenching of Trp fluorescence in buffer with 295nm excitation and 359nm emission wavelengths. Stern–Volmer constants are 3.45 ± 0.03 M−1 for A3 and 4.0 ± 0.06 M−1 for RCAM A3.

