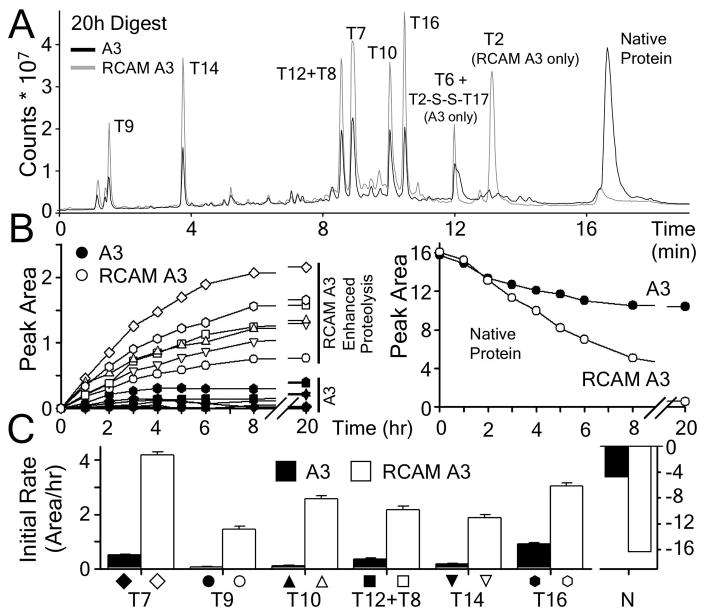
Figure 2.
Limited proteolysis of A3 and of RCAM A3. A) Chromatograms of both proteins after 20h of incubation at 37°C. Peaks are labeled with tryptic fragments that were identified by mass spectrometry. B) Time dependent accumulation of tryptic fragments of A3 (filled symbols) and RCAM A3 (open symbols). The right panel shows the decrease of native protein over time. C) Rates of tryptic cleavage obtained from the initial slopes of the time courses.

