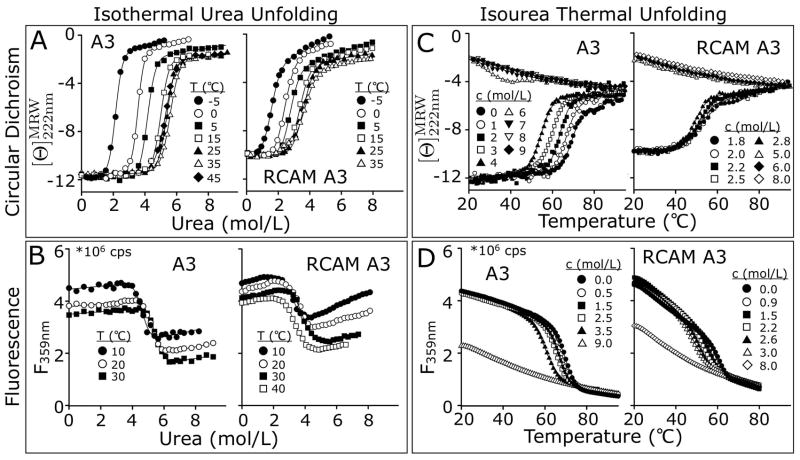
Figure 4.
One–dimensional analysis of A3 and RCAM A3 unfolding to obtain transition midpoints and unfolding cooperativity. Iso–thermal urea unfolding monitored A) by CD at 222 nm and B) by fluorescence (λEx = 280nm, λEm = 359nm). Iso–urea thermal unfolding at a scan rate of 2°C/min monitored C) by CD at 222 nm and D) by fluorescence (λEx = 280nm, λEm = 359nm).

