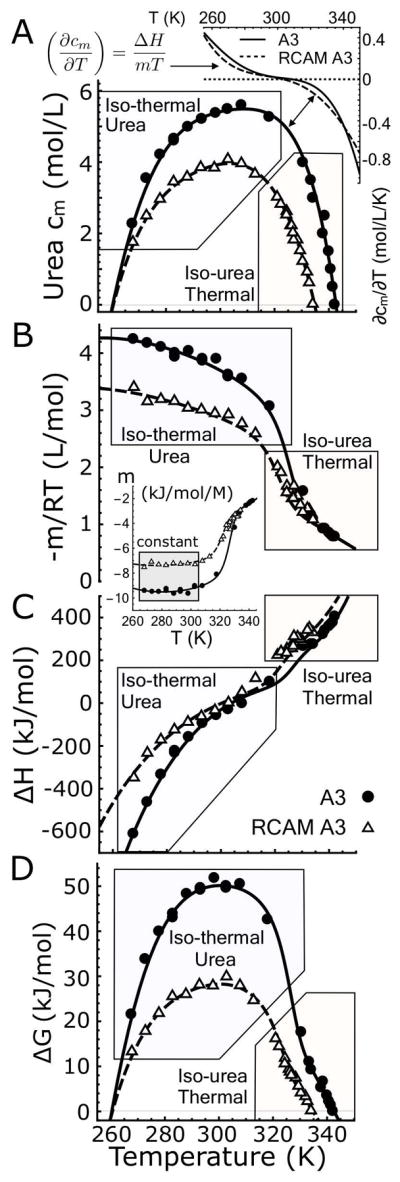
Figure 5.

A) Urea–temperature phase diagrams of A3 and RCAM A3 fit with a fifth–order Taylor expansion according to Eq. 8. Inset: First derivative of the phase diagrams, ∂cm/∂T. B) Experimental −m/RT–values determined from isothermal–urea unfolding and −m/RT–values calculated from the experimental enthalpies from iso–urea thermal unfolding using Eq. 9. Inset: Traditional m–values expressed in (kJ/mol/M). Note they are constant at low temperature (gray box). C) Experimental enthalpies determined from iso–urea thermal unfolding and enthalpies calculated from the experimental m–values from iso–thermal urea unfolding using Eq. 10. D) Free energies of unfolding for A3 and RCAM A3 obtained from the Linear Extrapolation Method, Eq. 11. Fits in panels B and C are 2–dimensional projections of (−m/RT)[T, c] and ΔH[T, c] in which the urea concentration axis is replaced with the Taylor expansion of the phase diagram, cm[T], Eq. 8. Fits in panel B, C and D result from the global analysis of the CD data shown in Fig. 4A & C and Fig. 1 of the Supporting Information.
