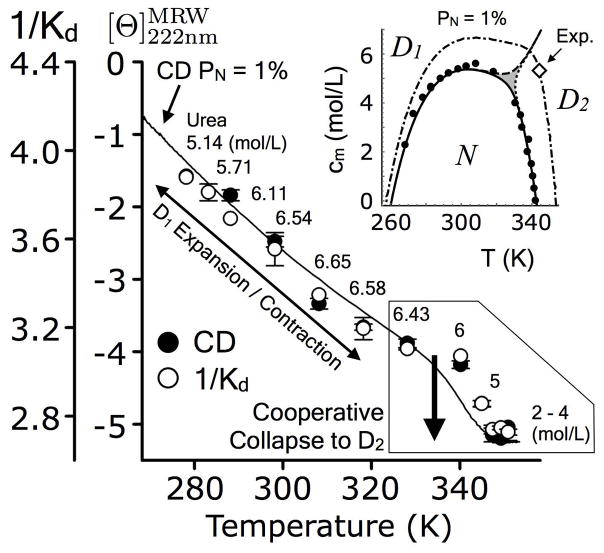
Figure 6.
Analytical size–exclusion chromatography (1/Kd) and circular dichroism of A3 as a function of temperature at the indicated urea concentrations corresponding to the 1% native state phase boundary (inset). Transition is ~342K and 5.3M urea. Solid line represents the CD signal at a native population of 1% according to the global fitting in Fig. 2 of the Supporting Information. Diamond (inset) represents the approximate midpoint of the D1 ⇌ D2 transition observed experimentally.

