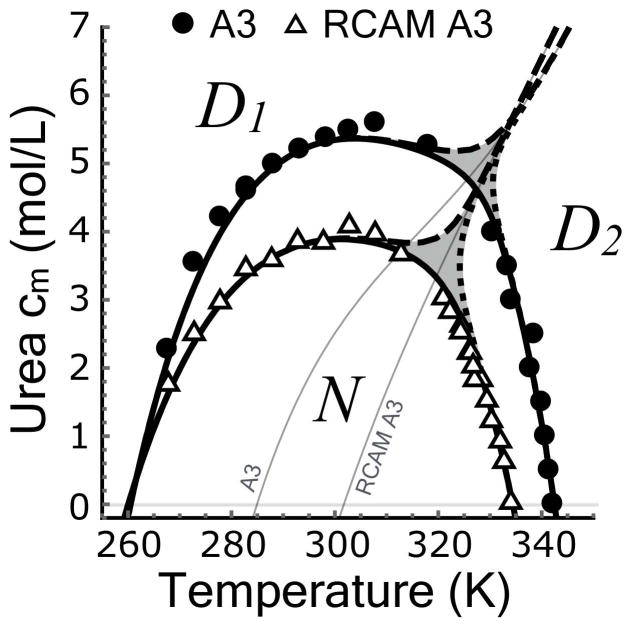
Figure 7.
Urea–temperature phase diagram in which the experimental transition midpoints are compared with the resulting phase boundaries of the three–state model involving an expanded urea–denatured state at low temperature/high urea (D1) and a compact thermally–denatured states at high temperature/low urea (D2). Phase boundaries for N (solid line), D1 (dashed line) and D2 (dotted line). Gray areas represent regions in which all three states are less than 50%. Thin gray lines represent the extrapolation of the D1 ⇌ D2 transition to the absence of urea.

