FIGURE 4.

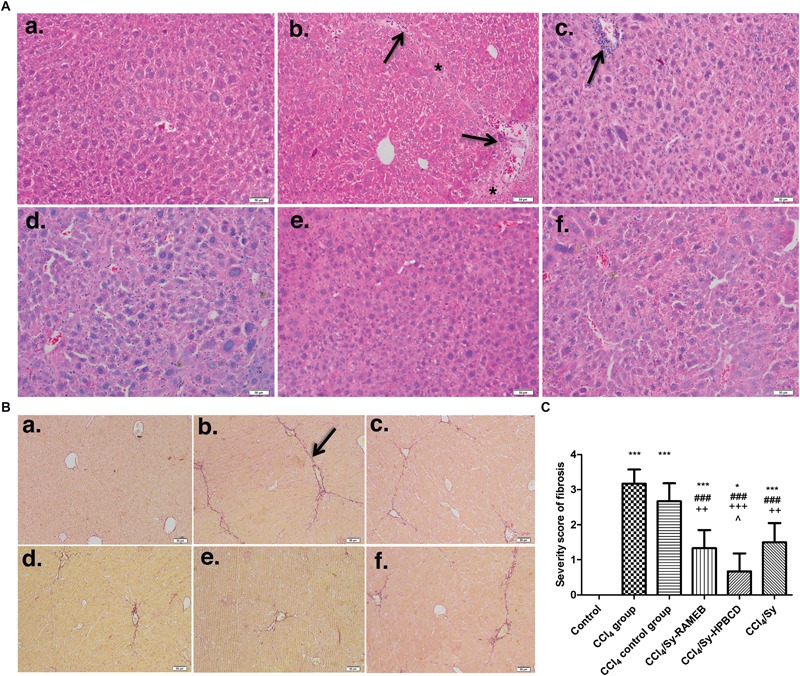
Effect induced by Sy-HPBCD and Sy-RAMEB complexes on the histological changes in liver of CCl4-treated mice. (A) H&E. (a) Control group: normal lobular architecture and cell structure; (b) CCl4-treated group: extensive hepatocellular damage with the presence of inflammatory cell infiltration, steatosis and necrosis, pseudo-lobular formation with collagen deposition; (c) CCl4-control group: the recovery was still weak and aspect almost similar to CCl4-treated group; (d) CCl4 and Sy-RAMEB co-treated group: mild inflammation, minimal hepatocellular necrosis and less extended fibrotic septa; (e) CCl4 and Sy-HPBCD co-treated group: histological aspect closest to the control with minimal inflammatory cells; (f) CCl4 and free Sy co-treated group: minimal fibrotic changes are present. ∗Fibrotic septa and collagen deposition; arrow – inflammatory cell infiltration; scale bar – 50 μm. (B) Fouchet van Gieson trichrome. (a) Control group: no significant collagen deposition; (b) CCl4-treated group: substantial collagen deposition in the periportal and pericellular areas, large fibrous septa formation, pseudo-lobe separation; (c) CCl4-control group: the recovery was still weak and aspect almost similar with CCl4-treated group; (d) CCl4 and Sy-RAMEB co-treated group: less collagen deposition was observed than that in mice treated with CCl4 alone; (e) CCl4 and Sy-HPBCD co-treated group: histological aspect closest to the control; (f) CCl4 and free Sy co-treated group: fibrotic changes are still present; arrow- fibrotic septa and collagen deposition; scale bar – 50 μm. (C) Histogram showing the percentage area of Fouchet van Gieson staining of collagen. ∗p < 0.05 compared to control; ∗∗∗p < 0.001 compared to control; ###p < 0.001 compared to CCl4 group; ++p < 0.01 compared to CCl4 control group; +++p < 0.001 compared to CCl4 control group; ˆp < 0.05 compared to CCl4/Sy group.
