FIGURE 8.

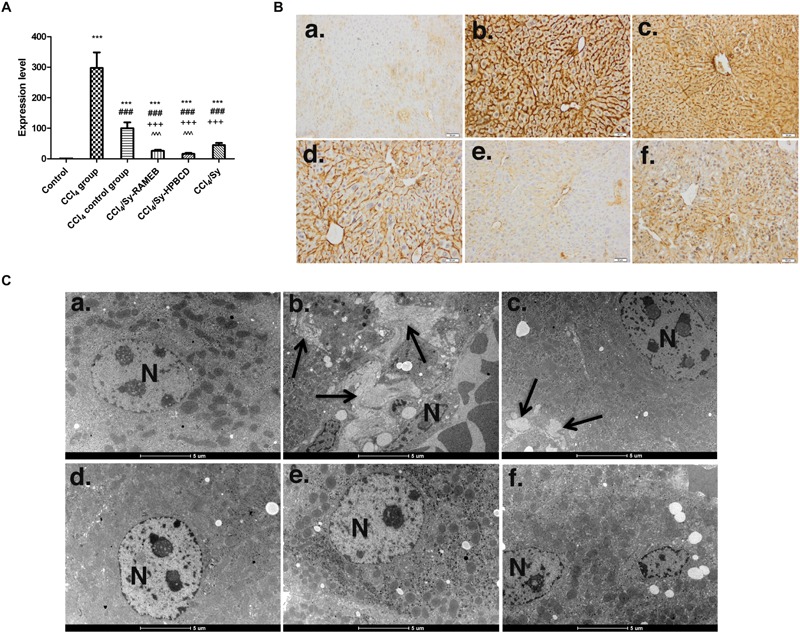
Effects of Sy-HPBCD and Sy-RAMEB complexes on collagen over-production. (A) RT-PCR analysis of Col 1 gene level. ∗∗∗p < 0.001 compared to control; ###p < 0.001 compared to CCl4 group; +++p < 0.001 compared to CCl4 control group; ˆp < 0.05 compared to CCl4/Sy group; ˆˆˆp < 0.001 compared to CCl4/Sy group. (B) Immunohistochemical expression of Col 1 in experimental livers. (a) Control group, (b) CCl4-treated group, (c) CCl4-control group, (d) CCl4 and Sy-RAMEB co-treated group, (e) CCl4 and Sy-HPBCD co-treated group, (f) CCl4 and free Sy co-treated group. (C) Collagen deposition in experimental livers by electron microscopy. (a) Control group, (b) CCl4-treated group, (c) CCl4-control group, (d) CCl4 and Sy-RAMEB co-treated group, (e) CCl4 and Sy-HPBCD co-treated group, (f) CCl4 and free Sy co-treated group; Collagen fibers (arrow); N, nucleus.
