
FIGURE 5.
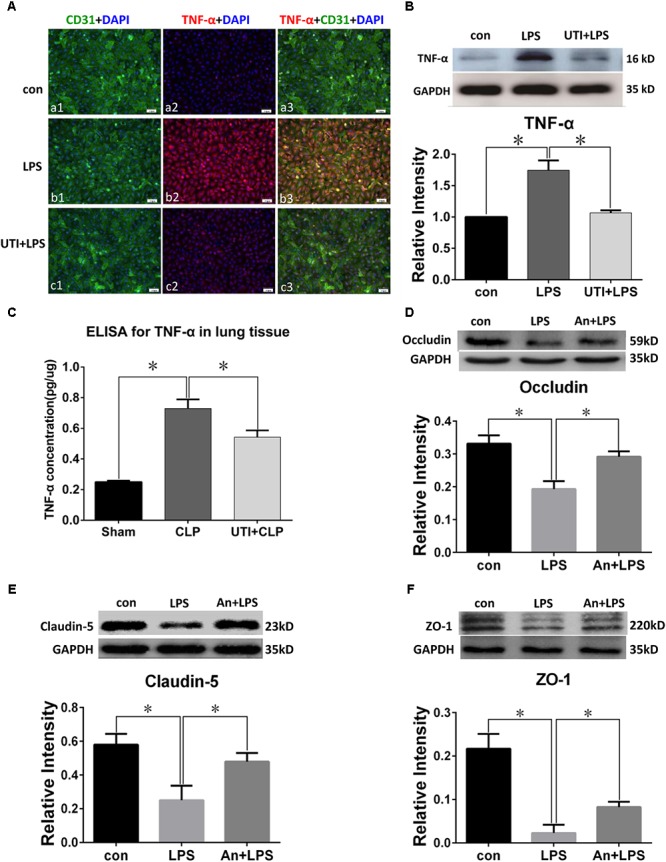
TNF-α expression was decreased by UTI in LPS-treated PMVECs and CLP lung tissue. Confocal images show TNF-α (A) expression (red) was markedly enhanced in PMVECs (green) of LPS group (Ab1–3) compared with control (Aa1–3) but obviously reduced when UTI pretreatment was given (Ac1–3). Western blot showing expression level of TNF-α (B) was significantly increased by LPS (p = 0.002) and reversed when pretreated with UTI (p = 0.003). ELISA analysis showing expression level of TNF-α (C) was significantly increased in CLP group compared with sham (p = 0.003); it was significantly decreased when pretreated with UTI (p = 0.007). Western blot showing expression level of occludin (D), claudin-5 (E), and ZO-1 (F) that was significantly decreased in LPS group when compared with the control (p = 0.006, 0.001, and 0.001, respectively); it was significantly augmented when pretreated with TNF-α receptor antagonist (An+LPS) (p = 0.024, 0.017, and 0.021, respectively). Scale bars: 50 μm, DAPI-blue. All values represent mean ± SD in triplicate; ∗ represent significant differences compared with corresponding control.