
FIGURE 4.
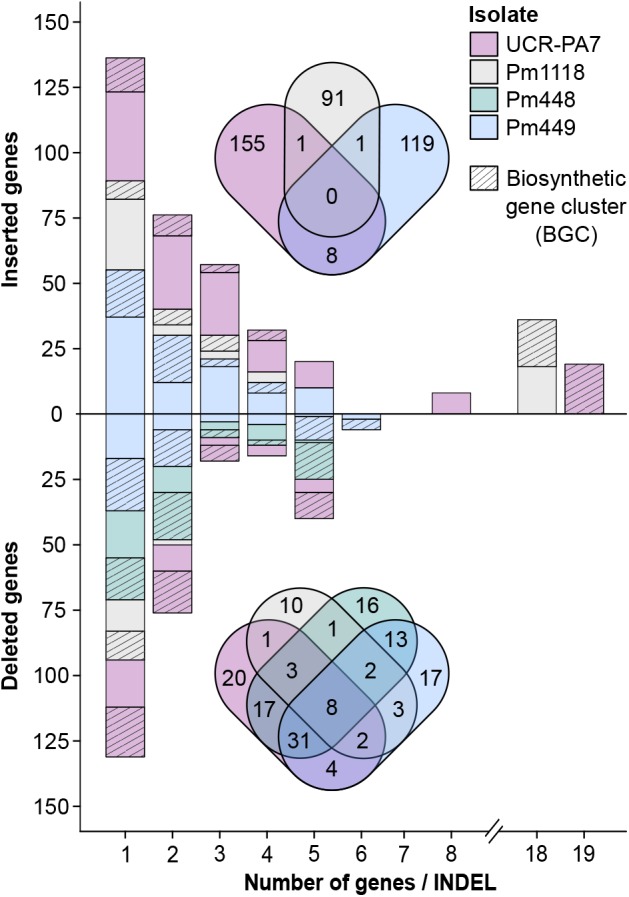
Size and amount of detected indel events encompassing protein-coding genes. The bar plot shows the number of genes and the size of the gene clusters in structural variant sites as well as the proportion of genes associated with BGCs. Venn diagrams show the overlap between genes in structural variant sites detected in the different Pm. minimum isolates.