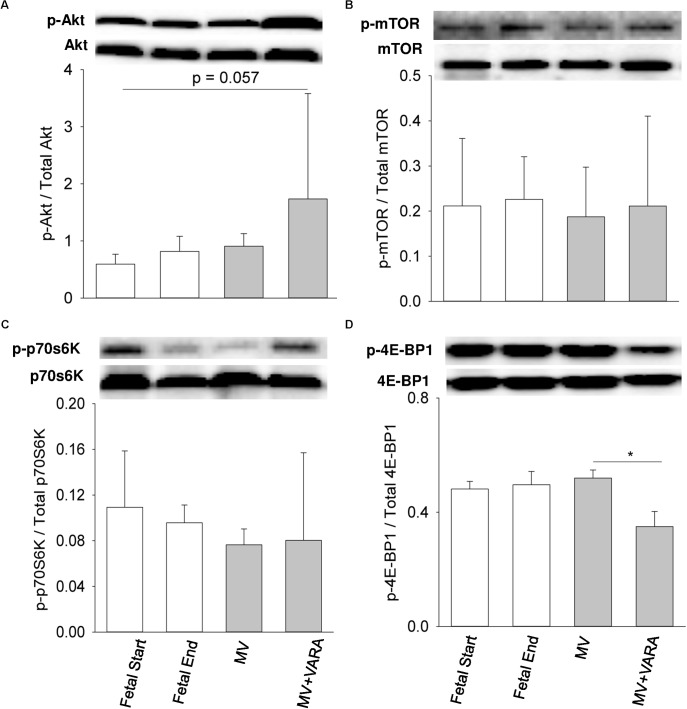
FIGURE 3.
Cytosolic signaling molecules. Western blots illustrate protein abundance of signaling molecules in cytosolic fraction, using representative samples from each group above the graphs. Graphs show p-Akt/total Akt protein (A), p-mTOR/total mTOR protein (B), p-p70S6/ total p70S6 kinase (C), and p-4E-BP1/total 4E-BP1 protein (D) in the groups of Fetal Start (n = 5), Fetal End (n = 5), MV (n = 5), and MV + VARA (n = 6). p: phosphorylated. Values are Mean (SD). ∗Indicates p < 0.05. MV, mechanical ventilation; VARA, vitamin A and all-trans retinoic acid.

