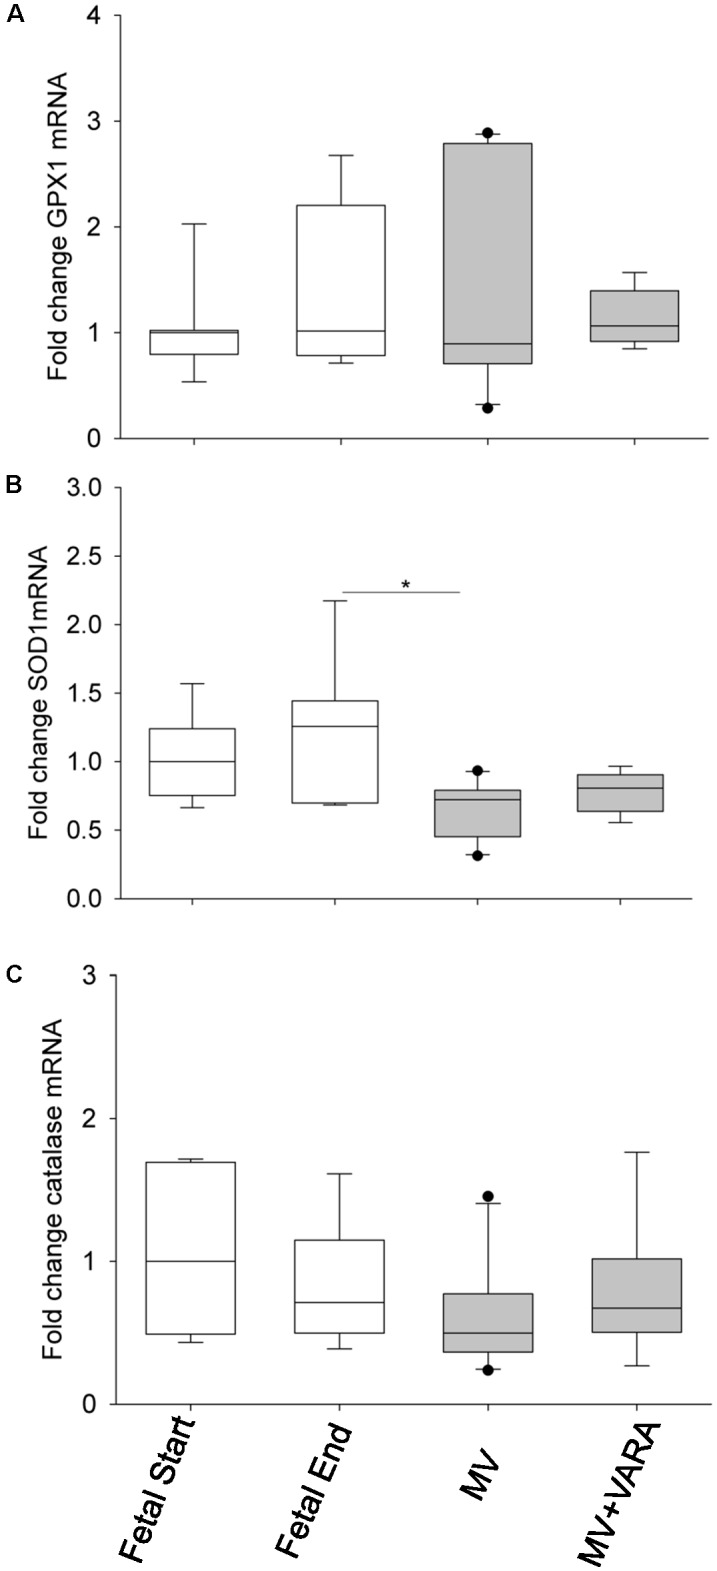
FIGURE 7.

Antioxidant mRNA levels. Graphs show GPX1 (A), SOD1 (B), and catalase (C) mRNA levels in the groups of Fetal Start (n = 7), Fetal End (n = 7), MV (n = 10), and MV + VARA (n = 6). Values are Median (25th and 75th centile), expressed as fold-change relative to Fetal Start group. ∗indicates p < 0.05. GPX1, glutathione peroxidase 1; SOD1, superoxide dismutase 1; MV, mechanical ventilation; VARA, vitamin A and all-trans retinoic acid.
