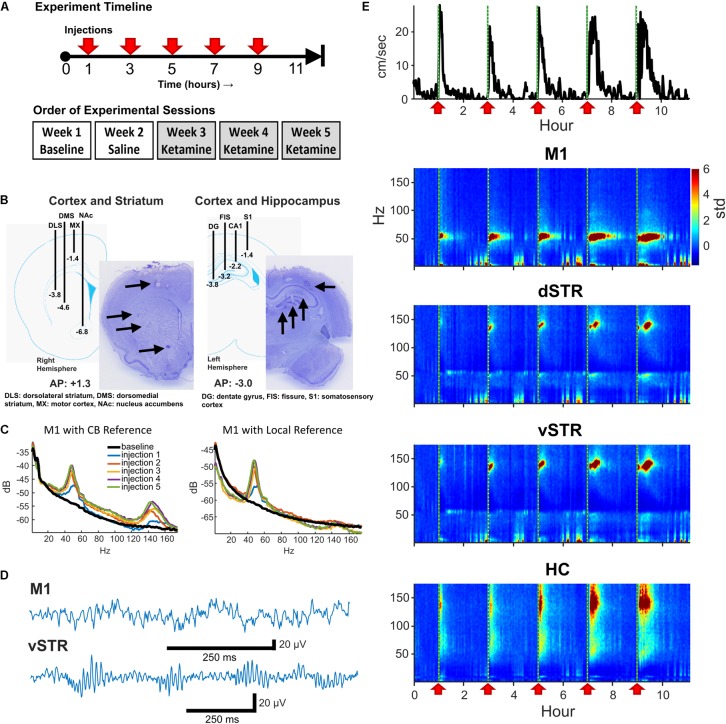
FIGURE 1.
Experiment design and neural recordings. (A) Top: Timeline of an individual experimental session. Five sub-anesthetic doses of ketamine (20 mg/kg, i.p.) or saline were injected throughout each 11+ hour recording session. One hour of pre-injection baseline was recorded prior to the first injection. Bottom: Timeline for experimental sessions. Each animal received a single ketamine or saline injection recording session each week. (B) Schematic of electrode array placement in the right-hemisphere (AP: +1.3, ML: +2.7 centered, DV: -6.8 deepest electrode) and the left-hemisphere (AP: -3.0, ML: -2.2 centered, DV: -3.8 deepest electrode) and exemplar histological sections. (C) Local-field electrodes were referenced to within-region electrodes to reduce contamination from volume conduction. To illustrate the effects of re-referencing, the power-spectral density (PSD) from an M1 electrode referenced to the cerebellar ground screw (left) or to a second within-region (M1) electrode (right) are presented. Recordings were acquired 10-min prior to ketamine injection (black) and 15 min following each ketamine injection (colored traces). Note the reduction in HFO power when using a local reference indicating that HFO activity was volume conducted. (D) Exemplar local-field traces of ketamine-induced gamma (M1) and HFOs (vSTR) recorded 15 min after injection. (E) Animal movement (top trace) and power spectrograms acquired from electrodes in M1, dSTR, vSTR, and HC. Ketamine injection times are indicated as vertical dashed lines and red arrows. Values are in standard deviations above the mean measured during the 30 min period preceding the first injection.

