FIGURE 5.
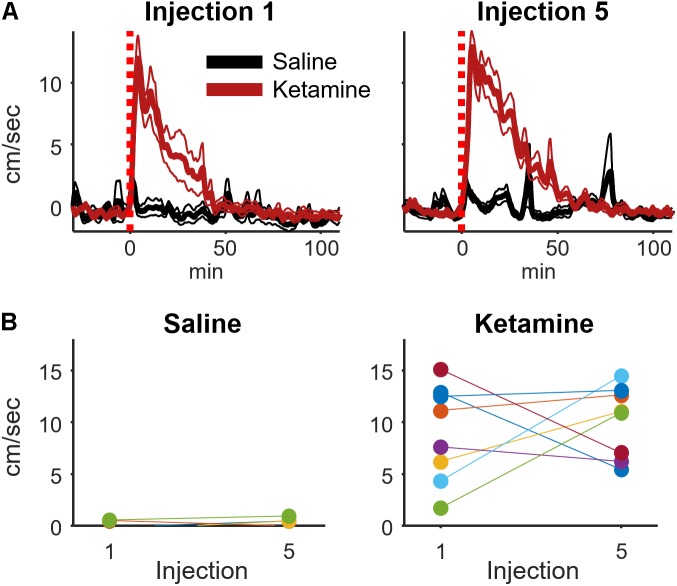
Ketamine-induced locomotion on the 1st and 5th injection. (A) Movement speed during each recording session was measured for periods surrounding ketamine or saline injection (bin size = 8 s, convolved with a 80 s Hanning window). This figure displays the mean and ±SEM across sessions (ketamine: n = 19, saline: n = 11 sessions from 8 rats) for the first and fifth injection. (B) To determine if movement speed was affected by multiple ketamine injections, average speed during the 2–20 min post-injection interval was analyzed and averaged for each rat. A strong effect of drug (ketamine vs. saline) was observed following injections 1 (t-test, p = 0.0015, n = 8 rats) and 5 (p = 0.00006, n = 8 rats). The effect of multiple injections was determined by comparing within-subject responses on the 1st and 5th injection using paired t-tests. Neither saline nor ketamine groups exhibited a significant difference in mean movement speed between injections 1 and 5 (paired t-test, saline: p = 0.50, n = 7 rats; ketamine: p = 0.59, n = 8 rats).

