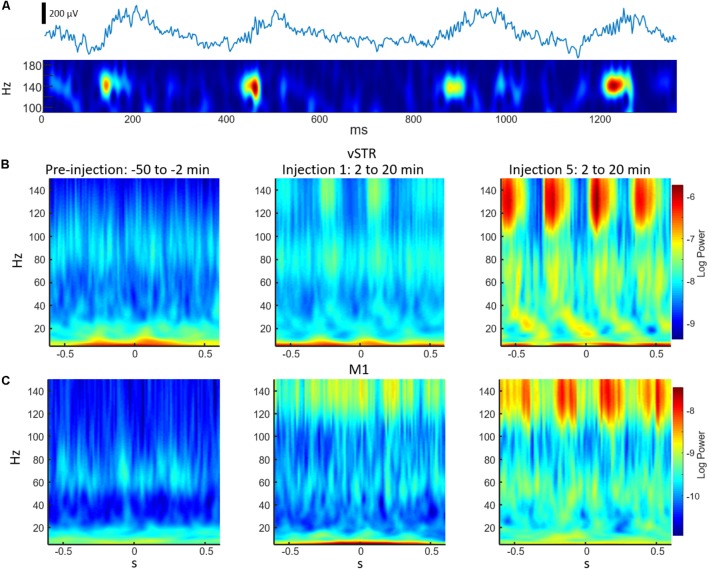
FIGURE 6.
Examples of cross-frequency coupling following ketamine injections. (A) The top trace is an unfiltered 2 s representative local-field recording acquired from the vSTR during the 2–20 min post-injection interval following injection #5. The bottom trace is a wavelet spectrogram of the same signal. The spectrogram highlights the high-frequency (140 Hz) oscillations nested in a slower (∼3 Hz) oscillation. (B) Average wavelet spectrogram acquired from the vSTR aligned on the time of the troughs of the slower (1–4 Hz) oscillation for the pre-injection baseline period (first column) and for the 2–20 min intervals following the first and fifth injections. This example illustrates the capacity of ketamine to enhance CFC. (C) As in B, but for average wavelet spectrogram of the M1.

