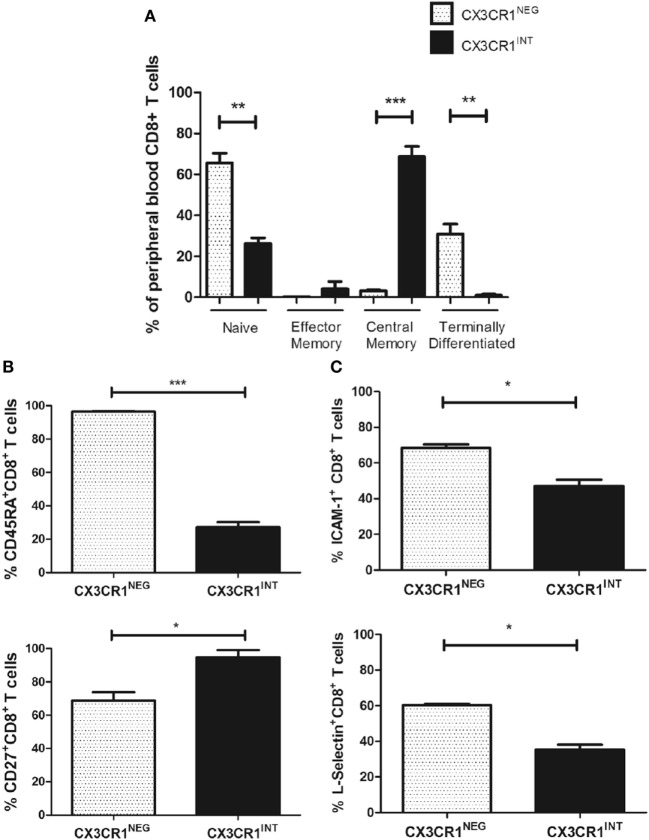
Figure 5.
CX3CR1NEG and CX3CR1INT populations represent significantly different CD8+ T cells in the peripheral blood with significantly different memory phenotypes, L-selectin, and ICAM-1 expression. (A) Bar charts showing the frequencies of naive, central memory, effector memory, and terminally differentiated CD8+ T cells, characterized by CD45RA and CD27 expression within the CX3CR1NEG and CX3CR1INT populations in peripheral blood of six non-cancer controls. (B) Bar chart showing frequencies of peripheral blood-derived CD8+ T cells expressing CD45RA (top) and CD27 (bottom) within CX3CR1NEG and CX3CR1INT populations (n = 3). (C) Bar chart showing frequencies of peripheral blood-derived CD8+ T cells ICAM-1 and L-selectin within CX3CR1NEG and CX3CR1INT populations (n = 3). p < 0.05, **p < 0.01, ***p < 0.001 by unpaired t tests.

