
Figure 1.
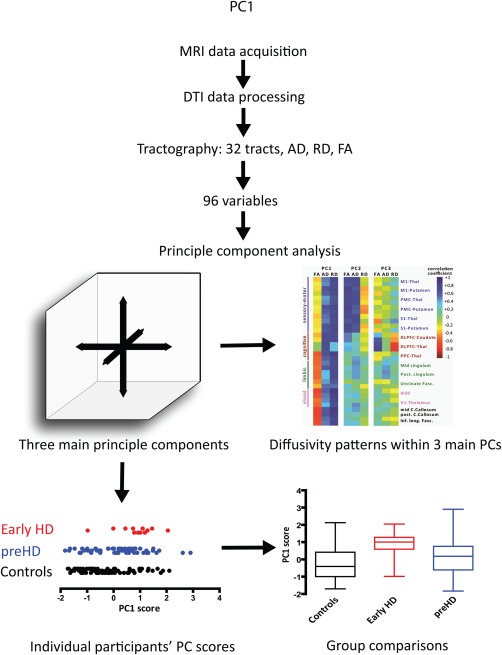
Study workflow. After processing data from the DTI sequence, tractography was employed to discern 15 tracts bilaterally, the mid corpus callosum and posterior corpus callosum so that, altogether, we derived 32 tracts. From each tract we extracted information about axial (AD) and radial diffusivity (RD) as well as fractional anisotropy (FA). Hence, we included 96 diffusivity measures in our PCA. The first 3 principle components, each of which contains information on all 3 diffusivity measures (AD, RD, FA) explained 56% of the variability in the data. The heatmap illustrates the relative contribution of each tract's diffusivity measures to the respective PC to show the diffusivity patterns for each PC across all tracts. For the three main PCs, we then calculated a principle component score for each participant followed by group comparisons of PCs [Color figure can be viewed at http://wileyonlinelibrary.com]