
Figure 3.
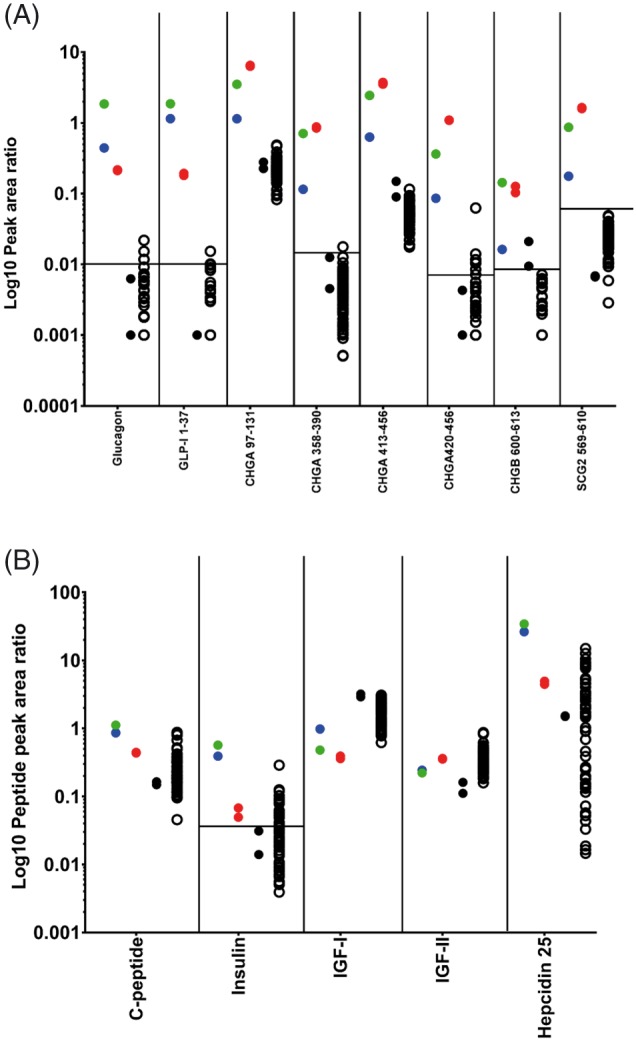
(A) Peak area ratio values of potential diagnostic peptides for glucagonoma – showing glucagon, proglucagon 72–108 and peptides from CHGA, CHGB, SCG2 and VGF. The pretreatment sample from Case study 1 is green, whilst the 4‐day treatment sample is blue, the duplicate extractions from Case study 2 are red, the black filled circles are duplicate extractions of the insulinoma sample, and the open black circles are the remaining 62 control samples. (B) Corresponding peptide peak area ratios for other plasma peptides including insulin, C‐peptide, hepcidin 25, IGF‐I and IGF‐II. In both graphs, the horizontal line for each peptide corresponds to the threshold for peaks having a signal‐to‐noise ratio greater than 3; any data point below this line could be considered as noise [Color figure can be viewed at http://wileyonlinelibrary.com]