
Figure 2.
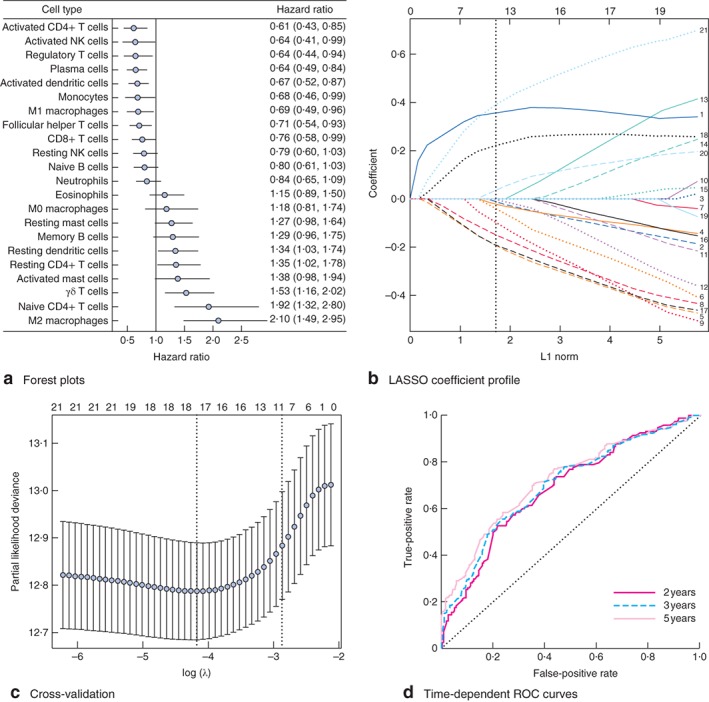
Construction of the immunoscore model. a Forest plots showing associations between different immune cell subsets and overall survival in the training cohort. Unadjusted hazard ratios are shown with 95 per cent confidence intervals. NK, natural killer. b Least absolute shrinkage and selection operator (LASSO) coefficient profiles of the fractions of 21 immune cell types. The dotted line indicates the value chosen by tenfold cross‐validation. Immune cell type: 1, M2 macrophages; 2, M1 macrophages; 3, M0 macrophages; 4, CD8+ T cells; 5, activated memory CD4+ T cells; 6, regulatory T cells; 7, neutrophils; 8, activated dendritic cells; 9, monocytes; 10, follicular helper T cells; 11, resting NK cells; 12, activated NK cells; 13, activated mast cells; 14, resting mast cells; 15, memory B cells; 16, naive B cells; 17, plasma cells; 18, γδ T cells; 19, eosinophils; 20, resting dendritic cells; 21, naive CD4+ T cells. c Tenfold cross‐validation for tuning parameter selection in the LASSO model. The partial likelihood deviance is plotted against log (λ), where λ is the tuning parameter. Partial likelihood deviance values are shown, with error bars representing s.e. The dotted vertical lines are drawn at the optimal values by minimum criteria and 1 – s.e. criteria. In b and c, the numbers above the graph represent the number of cell types involved in the LASSO model. d Immunoscore measured by time‐dependent receiver–operating characteristic (ROC) curves in the training cohort. The area under the ROC curve was 0·68, 0·69 and 0·72 for the immunoscore at 2, 3 and 5 years respectively