
Figure 3.
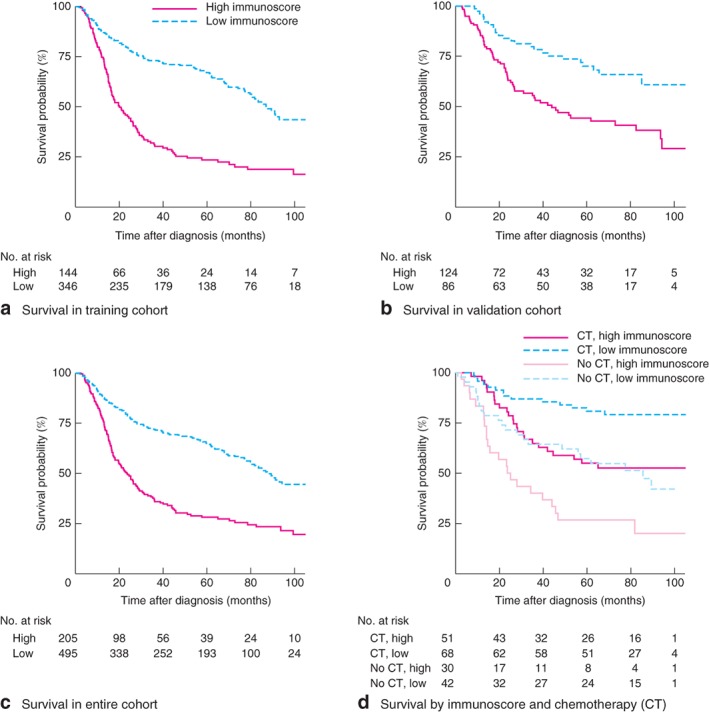
Survival impact of the immunoscore. a–d Kaplan–Meier curves for overall survival by immunoscore group in the training cohort (a), validation cohort (b) and entire cohort (c), and for patients with stage II–III gastric cancer in subgroups stratified by both receipt of adjuvant chemotherapy (CT) and immunoscore (d). Hazard ratios are shown with 95 per cent confidence intervals. P < 0·001 (log rank test)