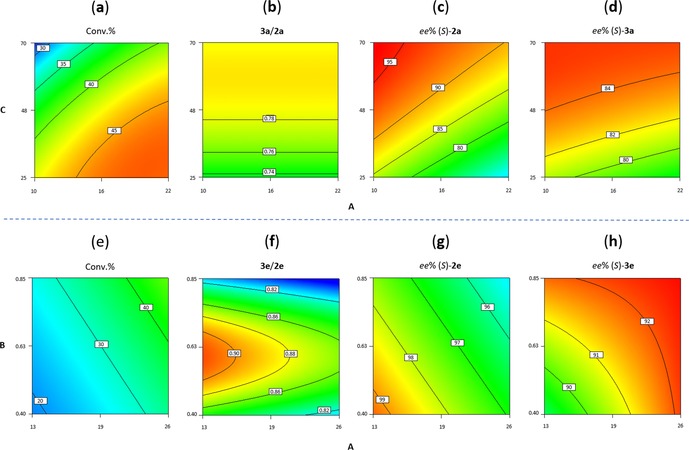
Figure 2.

Contour plots (DesignExpert®) of all responses; warmer (colder) colors indicate higher (lower) values; A=[HLADH] (μM; x‐axis); B=[NAD+] or C=[1 a] (mM; y‐axis). Conversion of 1 a (a), ratio 3 a/2 a (b), ee of (S)‐2 a (c) and ee of (S)‐3 a (d); conversion of 1 e (e), ratio 3 e/2 e (f), ee of (S)‐2 e (g) and ee of (S)‐3 e (h). [NAD+] set to 0.5 mM in plots (a–d); [1 e] set to 30 mM in plots (e–h).
