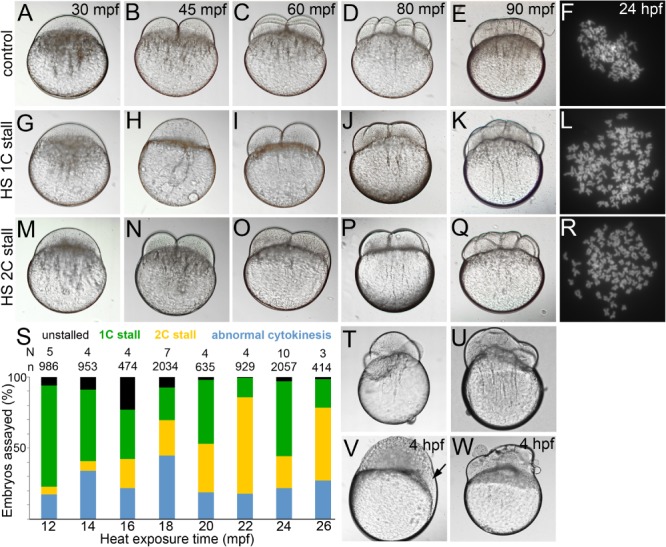
Figure 1.

Normal cytokinesis geometries in 1C and 2C stalls. A–E,G–K,M–Q: Differential interference contrast images of live control and 1C and 2C stalls from heat shocked embryos, that are offset from controls by one‐cell division cycle each. F,L,R: Metaphase chromosome spreads at ∼30 hpf show diploid chromosome numbers in controls and tetraploid chromosome numbers in 1C and 2C stalls. S: Categories of embryos obtained across all heat shocks. T,U: Embryos undergoing abnormal cytokinesis. V,W: Abnormal cytokinesis embryos transition into embryos with acellularized patches (arrow in V) or syncytia.
