
Figure 3.
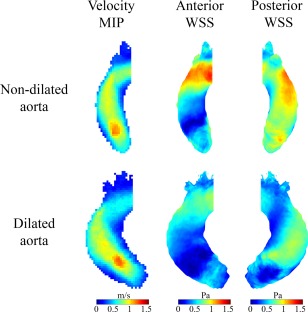
Cohort‐averaged 3D maps for velocity and WSS for BAV patients with aortic dilatation (lower row) and without aortic dilatation (upper row) displayed in a shared geometry.
Official websites use .gov
A
.gov website belongs to an official
government organization in the United States.
Secure .gov websites use HTTPS
A lock (
) or https:// means you've safely
connected to the .gov website. Share sensitive
information only on official, secure websites.
Cohort‐averaged 3D maps for velocity and WSS for BAV patients with aortic dilatation (lower row) and without aortic dilatation (upper row) displayed in a shared geometry.