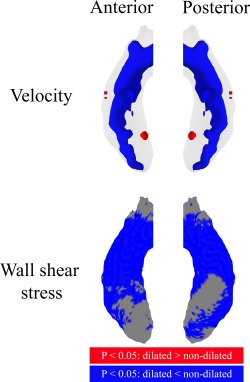
Figure 5.

P‐value maps displayed in a shared geometry of the ascending aorta from the anterior and posterior, displaying significant differences for velocity and WSS between patients with and without aortic dilatation. Red areas indicate significantly higher values for dilated aortas and blue areas for nondilated aortas.
