
Figure 3.
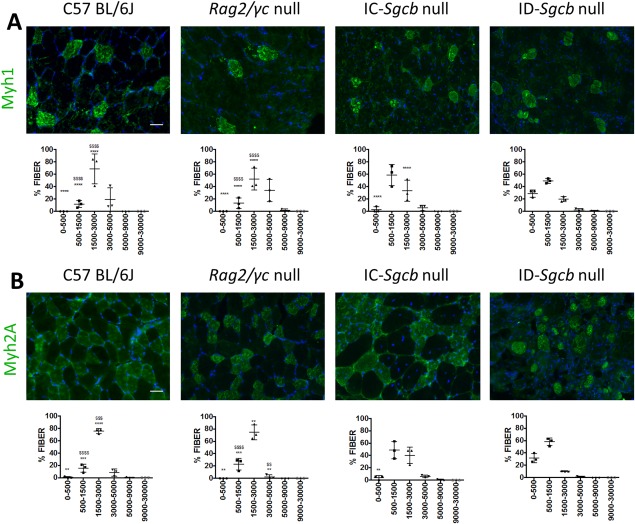
Immunofluorescence staining for fiber types from skeletal muscle sections of 7‐month‐old C57Bl/6J, Rag2/γc‐null, IC‐Sgcb‐null, and ID‐Sgcb‐null mice. Antibodies used for this immunostaining indicate fiber types 1 (A) and 2A (B). Bar = 50 μm. Fiber cross‐sectional area (CSA) was measured and the distribution is shown as mean ± standard deviation for both slow and glycolytic type A fibers. Several sections from 3 mice for each cohort were evaluated. One‐way ANOVA test: compared with IC‐Sgcb ($) and compared with ID‐Sgcb (*) (n = 3): **,$$ P < 0.01; ***P < 0.001; ****,$$$$ P < 0.0001. [Color figure can be viewed at http://wileyonlinelibrary.com]