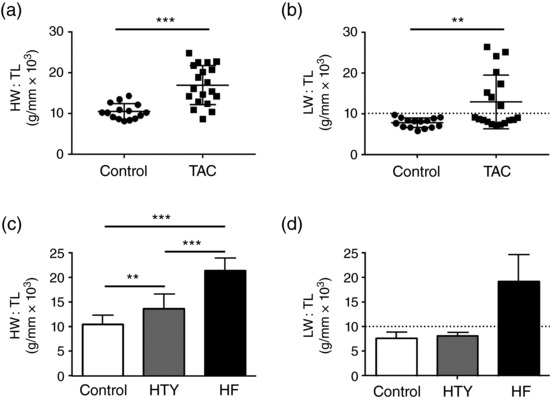
Figure 1.

Changes in heart weight and lung weight induced by transverse aortic constriction (TAC). (a, b) Scatter plots with bars showing means ± SD for the ratio of heart weight to tibia length (HW:TL; a) and lung weight to tibia length (LW:TL; b) of control (N = 15) and TAC (N = 19) animals. The dashed line in (b) shows the demarcation between hypertrophy (HTY) and heart failure (HF; 10.2 g/mm × 103, mean + 2 SD of control). (c, d) HW:TL (c) and LW:TL (d), separated into control (N = 15), HTY (N = 11) and HF (N = 8) groups (as described in the main text). ** P < 0.01, *** P < 0.001; (a) Student's t test; (b) Kruskal–Wallis test; (c, d) one‐way ANOVA, Bonferroni‐corrected post hoc test
