Figure 2.

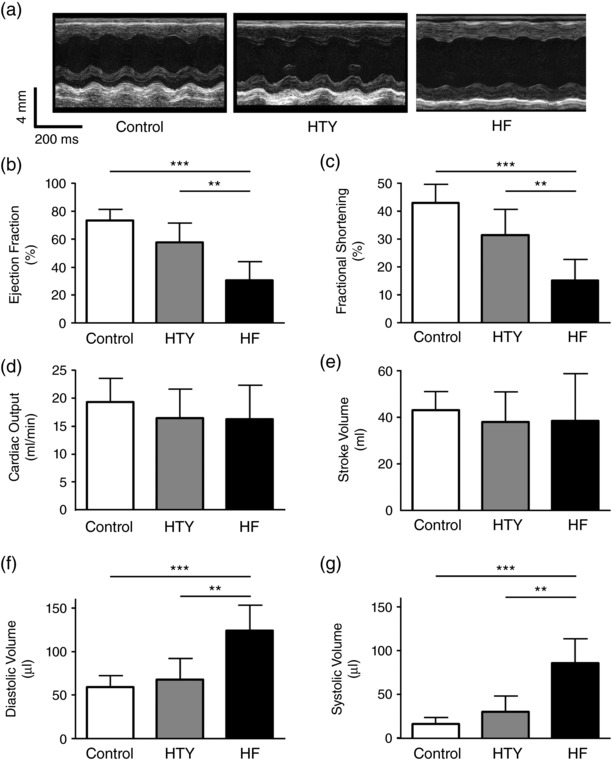
In vivo measurement of cardiac function in control, HTY and HF mice. (a) Representative in vivo M‐mode echocardiograms from control (left), HTY (middle) and HF (right) mice. (b–f) Mean data showing ejection fraction (b), fractional shortening (c), cardiac output (d), stroke volume (e), diastolic volume (f) and systolic volume (g) in control (N = 7), HTY (N = 5) and HF (N = 7) mice. ** P < 0.01, *** P < 0.001; one‐way ANOVA, Bonferroni‐corrected post hoc test
