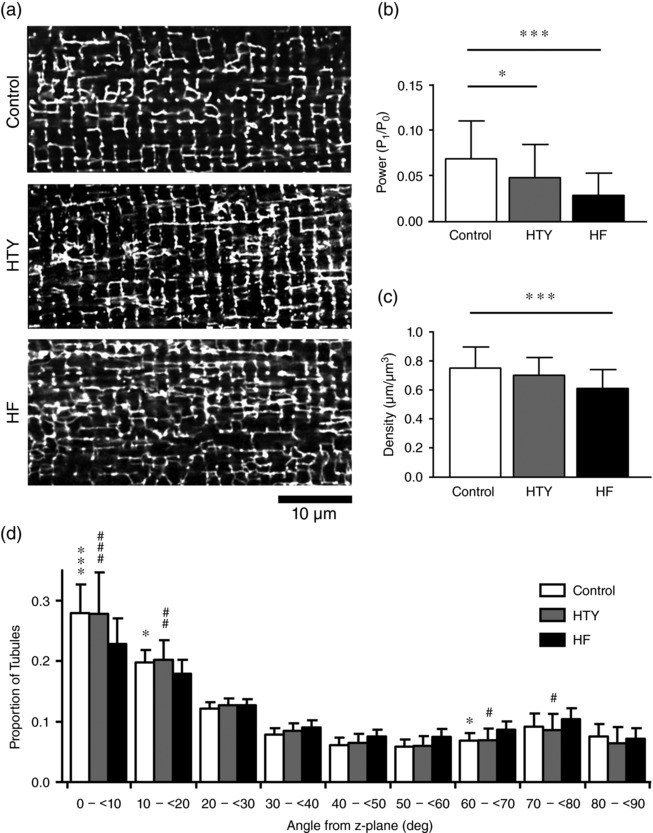
Figure 4.

Changes in t‐tubule morphology in HTY and HF. (a) Representative confocal images of control (top), HTY (middle) and HF (bottom) myocytes, stained with di‐8‐ANEPPS. (b) The power of the fast Fourier transformation first harmonic (P 1/P 0). (c) T‐tubule density. (d) T‐tubule orientation (angles in degrees from the z‐disc; data binned between the angles shown on the x‐axis) for control (n/N = 40/8), HTY (n/N = 26/5) and HF (n/N = 21/5) myocytes. * P < 0.05 or # P < 0.05, ** P < 0.01 or ## P < 0.01, *** P < 0.001 or ### P < 0.001; two‐way ANOVA, Bonferroni‐corrected post hoc test. In (d), asterisks indicate a significant difference between control and HF, and hash symbols indicate a significant difference between HTY and HF, at the same angle; there were no significant differences between control and HTY at any angle
