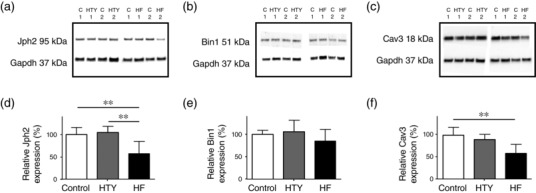
Figure 5.

Changes in protein expression after TAC. (a–c) Representative Western blots for Jph2 (a), Bin1 (b) and Cav3 (c) and Gapdh expression in myocyte lysates taken from two control (C1 and C2, replicated on the three blots), two HTY (HTY1 and HTY2) and two HF (HF1 and HF2) hearts. (d–f) Mean data for Jph2 (d), Bin1 (e) and Cav3 (f) protein expression normalized to Gapdh in control, HTY and HF hearts (N = 5, 4 and 4 hearts, respectively, each analysed in duplicate). ** P < 0.001, one‐way ANOVA, Bonferroni‐corrected post hoc test
