Figure 6.

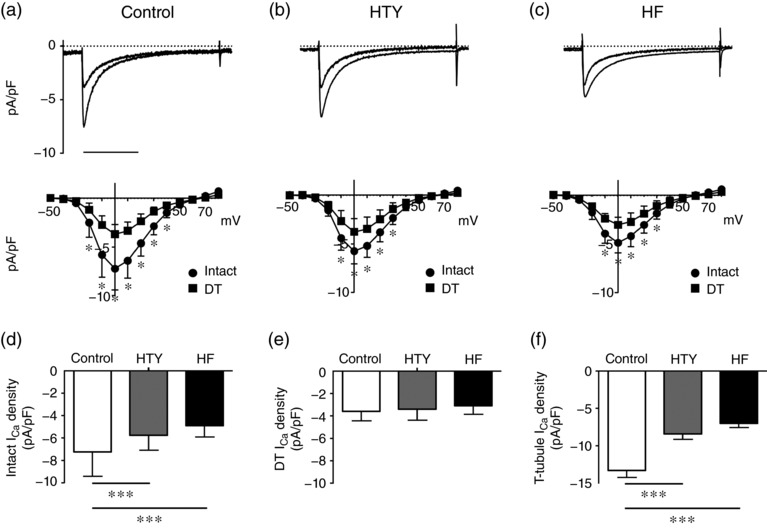
Changes in L‐type Ca2+ current (I Ca) associated with TAC. (a–c) Top panels are representative records of I Ca from intact and detubulated (DT) control (a), HTY (b) and HF (c) myocytes. Scale bar represents 200 ms. The corresponding mean I Ca density–voltage relationships are shown below for intact (circles) control (n/N = 41/10), HTY (n/N = 22/7) and HF (n/N = 21/5) myocytes and detubulated (squares) control (n/N = 43/10), HTY (n/N = 25/7 and HF (n/N = 21/5) myocytes. (d) Mean I Ca density at 0 mV in intact control, HTY and HF myocytes. (e) Mean I Ca density at 0 mV in DT control, HTY and HF myocytes. (f) Mean ± SEM I Ca density (in picoamperes per picofarad) calculated at the t‐tubule membrane (see Methods). (a–c) * P < 0.001, two‐way repeated‐measures ANOVA, Bonferroni‐corrected post hoc test. (d, e) *** P < 0.001, two‐way ANOVA, Bonferroni‐corrected post hoc test. (f) *** P < 0.001, one‐way ANOVA, Bonferroni‐corrected post hoc test
