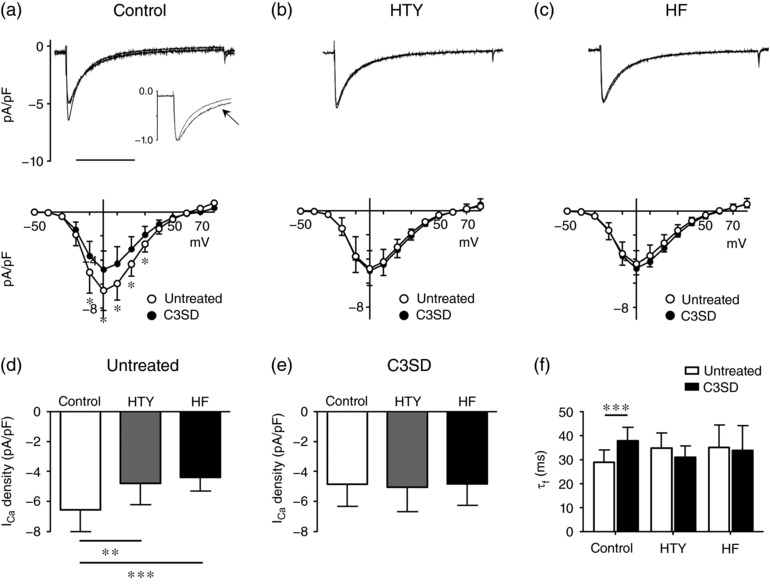
Figure 7.

Regulation of I Ca by caveolin 3 in TAC. (a–c) Top panels are representative records of I Ca recorded from intact control (a), HTY (b) and HF (c) myocytes with or without pre‐incubation with C3SD. The inset in (a) shows normalized I Ca to illustrate the slowing of inactivation of I Ca in the C3SD‐incubated myocyte (denoted by the arrow). Scale bar represents 200 ms. The corresponding mean I Ca density–voltage relationships are shown below. Open circles show I Ca without C3SD pretreatment (control n/N = 16/5, HTY n/N = 14/4 and HF n/N = 19/5), and filled circles show I Ca after incubation with C3SD (control n/N = 17/5, HTY n/N = 12/4 and HF n/N = 15/5). (d) Mean I Ca density at 0 mV recorded in untreated intact control, HTY and HF myocytes. (e) Mean I Ca density at 0 mV recorded in intact control, HTY and HF myocytes pre‐incubated with C3SD. (f) The fast component of I Ca inactivation (τf, in milliseconds, at 0 mV) in untreated (open bars) and C3SD‐treated (filled bars) control, HTY and HF myocytes. (a–c) * P < 0.001; two‐way repeated‐measures ANOVA, Bonferroni‐corrected post hoc test. (d–f) ** P < 0.01, *** P < 0.001; two‐way ANOVA, Bonferroni‐corrected post hoc test
